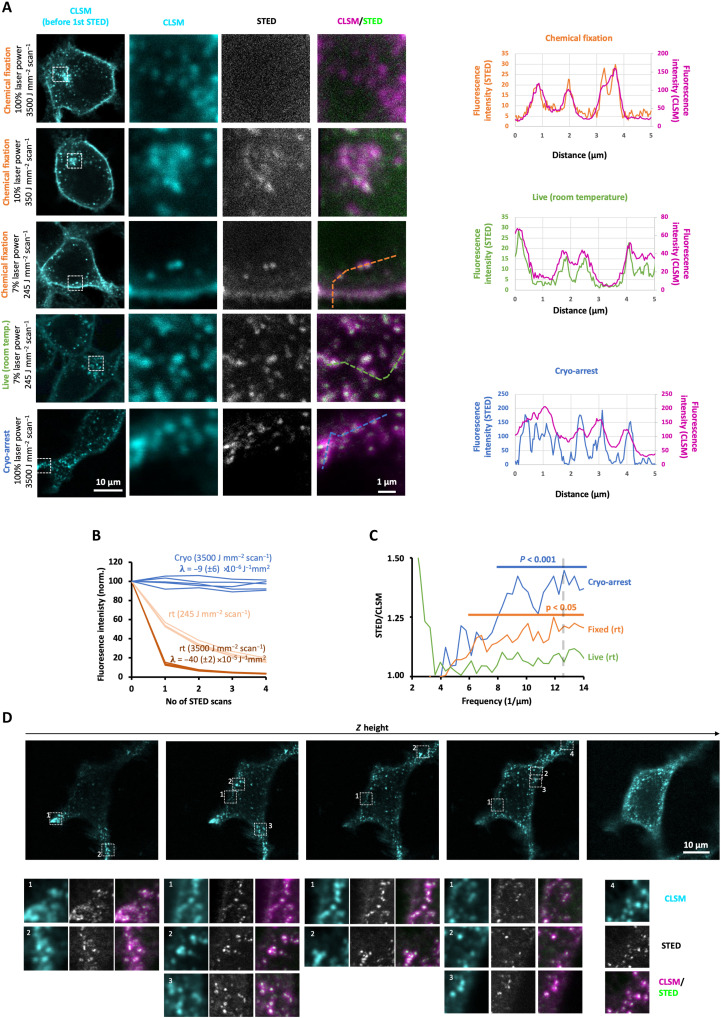
Fig. 3. STED nanoscopy of a dynamic receptor system under cryo-arrest.
(A) CLSM and STED nanoscopy of Alexa647-Snap-EGFR in chemically fixed (rows 1 to 3), live at room temperature (fourth row), and cryo-arrested (bottom row) MCF7 cells. CLSM of cells (first column; pixel size: 100 nm); detailed (pixel size: 40 nm) CLSM (second column) and STED (third column) scan of boxed area with indicated laser irradiation intensities. Fourth column: overlay, CLSM (magenta), and STED (green). Live: single scan; cryo-arrest: sum of 10 scans. Graphs: intensity profiles along the dotted lines depicted in the CLSM/STED overlay images (STED: color-coded to lines; CLSM: magenta). (B) Alexa647 photobleaching during STED scans at room temperature (rt) or under cryo-arrest (cryo) at the indicated depletion laser powers. λ: decay rates determined by exponential fits (mean ± SD, N = 5). (C) STED spatial frequency spectrum normalized by corresponding CLSM spectrum for different regions containing vesicles (cryo: n = 11; chemical fixation: n = 8; rt. live: n = 6); Horizontal lines: frequency range where STED information content is significantly higher than CLSM (Student’s t test); vertical dashed line: digital resolution. (D) Top row: 3D-CLSM of a cryo-arrested MCF7 cell. Lower rows: detailed high-resolution scans (5 × 5 μm; pixel size: 40 nm) of the indicated regions in the top row: CLSM (cyan), STED (gray), and merge (magenta and green).

