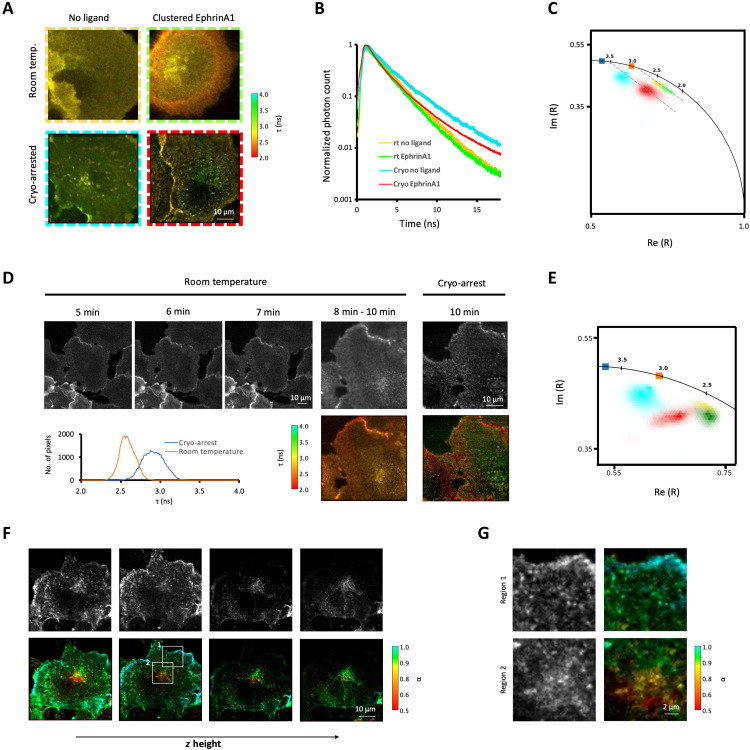
Fig. 4. Resolution of spatially distributed reaction states under cryo-arrest.
(A) Representative intensity-weighted average fluorescence lifetime (τ) images obtained by confocal FLIM of Cos7 cells stably expressing LIFEA2; without (left column) and with clustered EphrinA1 stimulation (right) at room temperature (rt; top) or under cryo-arrest (cryo; bottom). Color bar: τ (ns). (B) Normalized cumulative fluorescence decay histograms of LIFEA2 at room temperature and cryo-arrest, with (room temperature: green, N = 6, n = 9, cryo-arrest: red, N = 7, n = 16) and without (room temperature: yellow, N = 6, n = 10, cryo: cyan, N = 2, n = 11) clustered EphrinA1 stimulation. (C) Imaginary (Im) and real part (Re) of phasors (R) derived from the first harmonic of fluorescence decay data in (B); color-coded as in (B); squares: mCitrine only (blue: cryo-arrest; orange: room temperature; fig. S5, C and D); dashed lines: linear fit of phasors. (D) Confocal FLIM of a LIFEA2-expressing Cos7 cell after indicated times of clustered EphrinA1 stimulation before and during ultrarapid cryo-arrest. Top panels: fluorescence photon count; lower panels: τ (ns); graph: corresponding τ histogram at room temperature (orange) and cryo-arrest (blue). (E) Corresponding phasors of data in (D) (red: cryo-arrest; green: room temperature), with cumulative phasors from unstimulated cells in (C). (F) Fluorescence photon count (top panels) and fluorescence intensity–weighted fraction of the active conformation of LIFEA2 (bottom) at different z heights (rows) obtained by confocal FLIM upon cryo-arrest after 14-min stimulation with clustered EphrinA1. Color bar: fraction of LIFEA2 in active conformation (α). (G) Magnified regions of the boxed areas in (F).

