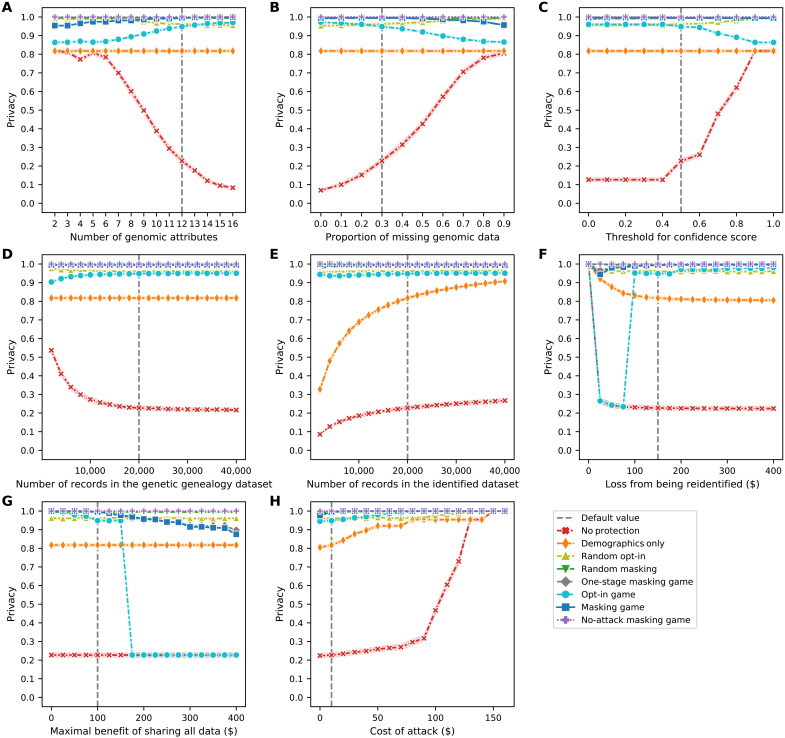
Fig. 5. Sensitivity of the data subjects’ average privacy as a function of the parameters in the model.
(A) Number of genomic attributes. (B) Proportion of missing genomic data. (C) Threshold for confidence score. (D) Number of records in the genetic genealogy dataset. (E) Number of records in the identified dataset. (F) Loss from being re-identified. (G) Maximal benefit of sharing all data. (H) Cost of an attack. Each line plot (depicted using Seaborn) shows the data subjects’ average payoffs, with error bars representing SDs, in eight scenarios.

