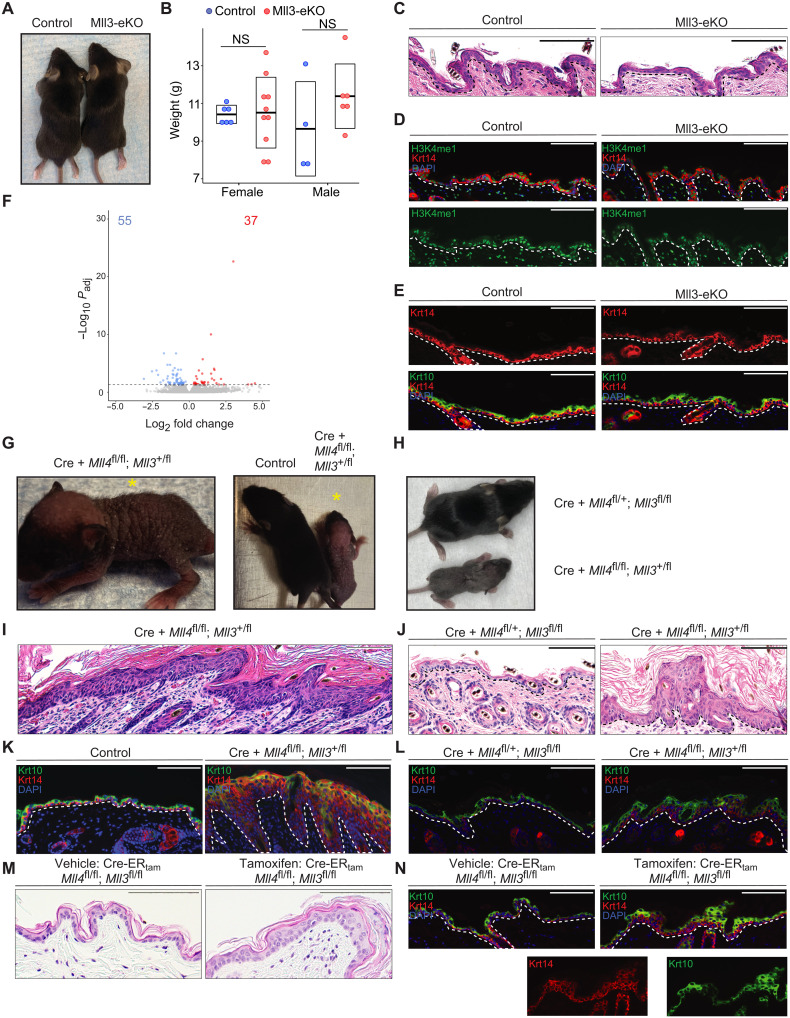
Fig. 3. In contrast to Mll4 loss, Mll3 deficiency leads to modest effects in the epidermis.
(A) Representative 3-week-old Mll3-eKO and control mice. (B) Weights of either male or female 3-week-old Mll3-eKO (red) and control (blue) mice (n = 9 to 16 mice per genotype, P = 0.49). NS, not significant. (C to E) Comparison of 3-week-old Mll3-eKO and control mice epidermis by (C) H&E staining, (D) IF staining of H3K4me1 (green), Krt14 (red), and DAPI (blue) or (E) IF staining of Krt14 (red), Krt10 (green), and DAPI (blue) (n = 3 mice per genotype). (F) Differentially expressed genes (55 down-regulated genes and 37 up-regulated genes) in isolated bulk epidermis of Mll3-eKO and control mice. Dashed line denotes adjusted P value of 0.05 (n = 6 mice per genotype). (G) Representative 1-week-old Krt14-Cre(+); Mll4fl/fl; Mll3+/fl mouse alone (yellow asterisk) (left) or beside a littermate control (right). (H) Littermate sibling Krt14-Cre(+); Mll4fl/+; Mll3fl/fl (top) and Krt14-Cre; Mll4fl/fl; Mll3+/fl (bottom) mice compared. (I) H&E staining of a Krt14-Cre(+); Mll4fl/fl; Mll3+/fl mouse epidermis (n = 3 mice per genotype). (J) Littermate sibling Krt14-Cre(+); Mll4fl/+; Mll3fl/fl and Krt14-Cre(+); Mll4fl/fl; Mll3+/fl mice compared by (J) H&E histological staining of the epidermis, and (K) IF staining for Krt14 (red), Krt10 (green), and DAPI (blue) (n = 3 mice per genotype). (M and N) Comparison of the epidermis of vehicle and tamoxifen-treated Krt14-CreERtam; Mll4fl/fl; Mll3fl/fl mice by (M) H&;E staining or (N) IF staining of Krt14 (red), Krt10 (green), and DAPI (blue) (n = 2 mice per group, one vehicle control and one genotype control). Black and white dashed lines delineate the epidermal and dermal boundary. Scale bars, 100 μM, unless otherwise noted.

