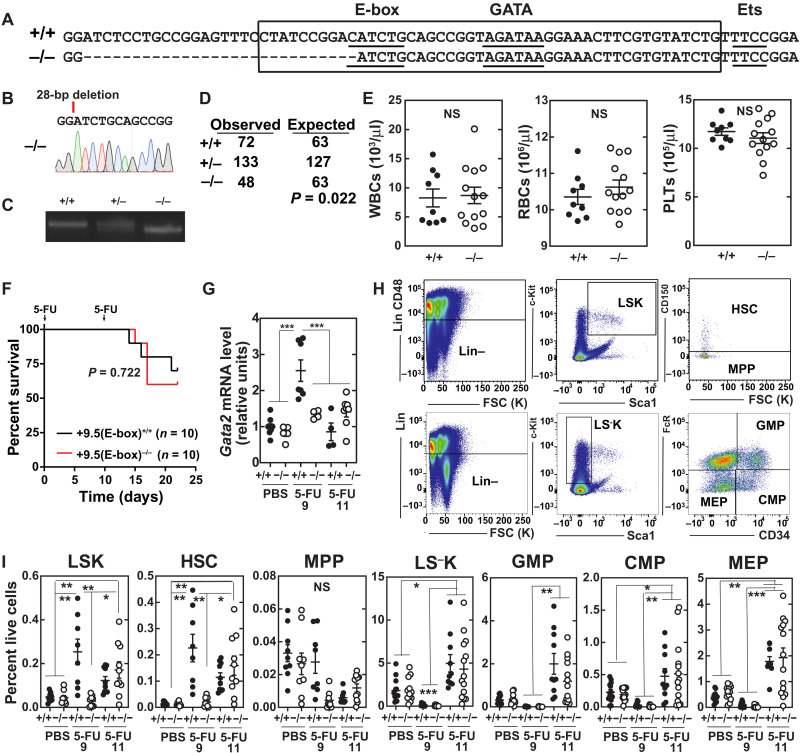
Fig. 3. +9.5 E-box accelerates regeneration kinetics.
(A) Sequence of WT (+9.5+/+) and E-box variant [+9.5(E-box)−/−] mice. (B) Sequence of mutant mice. (C) Polymerase chain reaction (PCR) genotyping. (D) Genotyping results at weaning from +9.5(E-box)+/− × +9.5(E-box)+/− matings (chi-square test) (E) Steady-state blood parameters [+9.5+/+ (n = 9) and +9.5(E-box)−/− (n = 12)]. (F) Kaplan-Meier survival curve of mice following two 5-FU doses (250 mg/kg; days 0 and 11; n = 10 per genotype). P = 0.0167, log-rank test. (G) mRNA quantification from bone marrow after vehicle (PBS), 9-day 5-FU, or 11-day 5-FU (250 mg/kg) treatment (n = 5 to 11 per condition from five experiments). (H) Flow cytometry scheme for quantification of LSK (Lin−CD48−Sca1+Kit+), HSC (Lin−CD48−Sca1+Kit+CD150+), MPP (Lin−CD48−Sca1+Kit+CD150−), LS−K (Lin−Sca1−Kit+), MEP (Lin−Sca1−Kit+FcγR−CD34−), CMP (Lin−Sca1−Kit+FcγR−CD34+), and GMP (Lin−Sca1−Kit+FcγR+CD34+). (I) Quantification of HSC, MPP, and LSKs from total bone marrow after vehicle (PBS), 9-day 5-FU, or 11-day 5-FU (250 mg/kg) treatment (percentage of live bone marrow cells) [PBS: WT (n = 9), +9.5(E-box)−/− (n = 9); day 9: WT (n = 8), +9.5(E-box)−/− (n = 10); day 11: WT (n = 10), +9.5(E-box)−/− (n = 10)]. *P < 0.05, **P < 0.01, ***P < 0.001, Tukey’s multiple comparisons test.

