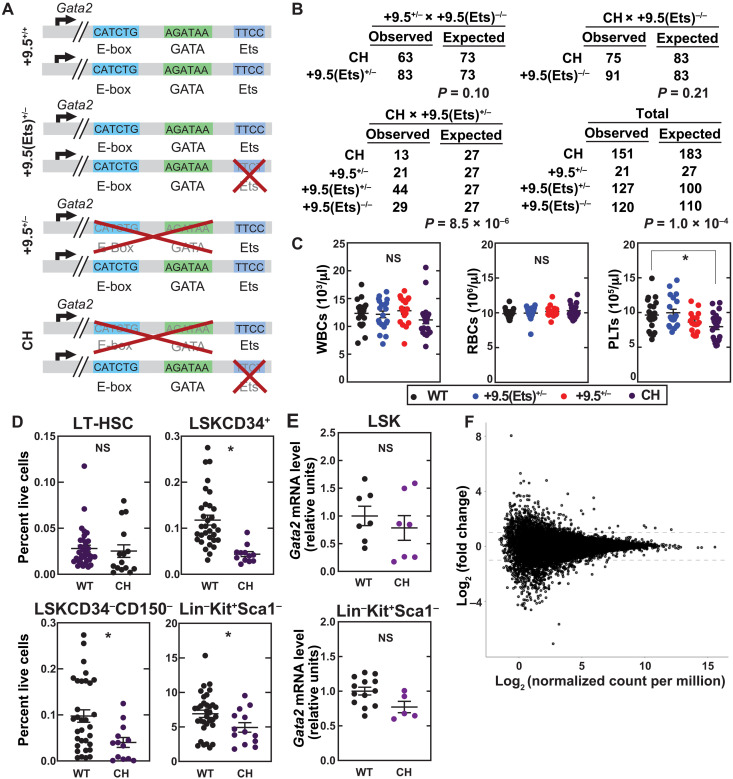
Fig. 4. Enhancer-engineered bone marrow failure mouse model.
(A) Model depicting the motif configurations within the Gata2 +9.5 in WT, +9.5(Ets)+/−, +9.5+/−, and CH mice. (B) Genotypes from breeding schemes used to generate CH mice. Probability was calculated using chi-square tests. (C) Steady-state peripheral blood parameters. Data are represented as mean ± SEM; *P < 0.05 (Tukey’s multiple comparisons test). (D) Flow cytometric quantification of LT-HSC (Lin−Sca1+Kit+CD150+CD48−), LSKCD34+, LSKCD34−CD150−, and Lin−Kit+Sca1−. (E) qPCR of purified cells. (F) RNA-seq of LT-HSCs (Lin−Sca1+Kit+CD150+CD34−).

