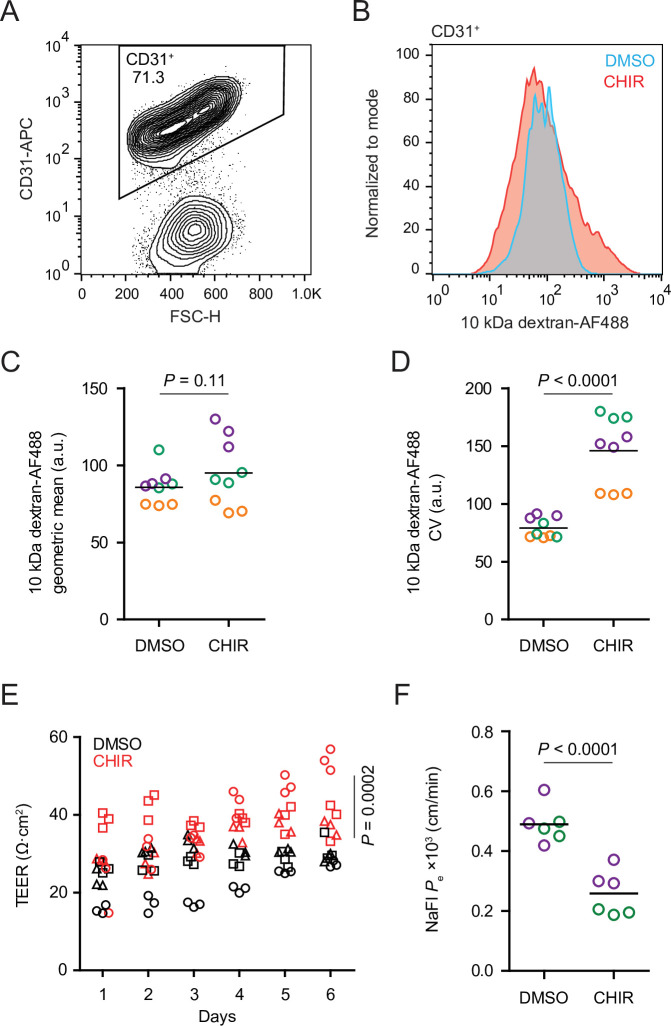
Figure 5. Functional properties of CHIR- and DMSO-treated endothelial cells (ECs).
(A) Flow cytometry analysis of CD31 expression in Passage 1 ECs following the dextran internalization assay. CD31+ cells were gated for further analysis. (B) Flow cytometry analysis of 10 kDa dextran-Alexa Fluor 488 (AF488) abundance in CD31+ cells. Cells were treated with DMSO or CHIR for 6 days prior to the assay. Representative plots from cells incubated with dextran for 2 hr at 37°C are shown. (C) Quantification of 10 kDa dextran-AF488 geometric mean fluorescence intensity in CD31+ cells. Treatment and assay conditions were as described in (B). Points represent replicate wells from three independent differentiations of the IMR90-4 line, each differentiation indicated with a different color. Bars indicate mean values. p-value: two-way ANOVA. (D) Quantification of the coefficient of variation (CV) of 10 kDa dextran-AF488 fluorescence intensity in CD31+ cells. Points represent replicate wells from three independent differentiations of the IMR90-4 line, each differentiation indicated with a different color. Bars indicate mean values. p-value: two-way ANOVA. (E) Transendothelial electrical resistance (TEER) of Passage 3 ECs. The x-axis indicates the number of days after seeding cells on Transwell inserts. Points represent replicate wells from three independent differentiations of the IMR90-4 line, each differentiation indicated with a different shape. p-value: two-way ANOVA. (F) Permeability of Passage 3 ECs to sodium fluorescein. Points represent replicate wells from two independent differentiations of the IMR90-4 line, each differentiation indicated with a different color. Bars indicate mean values. p-value: two-way ANOVA.


