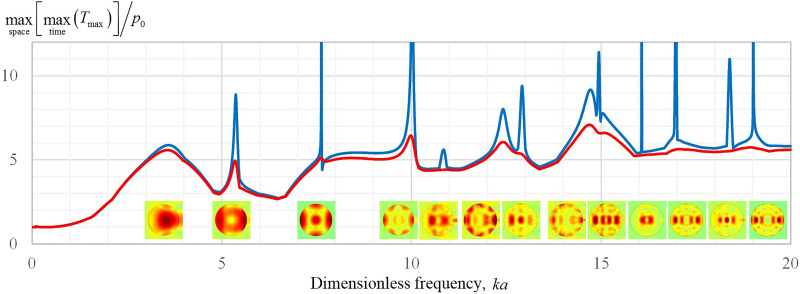
FIG. 1.
(Color online) Maximum in space and time of the maximum principal stress, , normalized by the incident plane wave amplitude p0, versus dimensionless frequency ka, where k is the wavenumber in the liquid, a is the stone radius. The modeled spherical stone is made from COM material. The blue line corresponds to the case when no losses are present in the stone, the red line represents simulations when an absorption that grows linearly with frequency is introduced to the elastic waves in the stone: , . Images below the curve represent spatial distribution of the maximum-in-time of the maximum principal stress, , for the frequencies where the curve has local maxima (i.e., the resonance frequencies).

