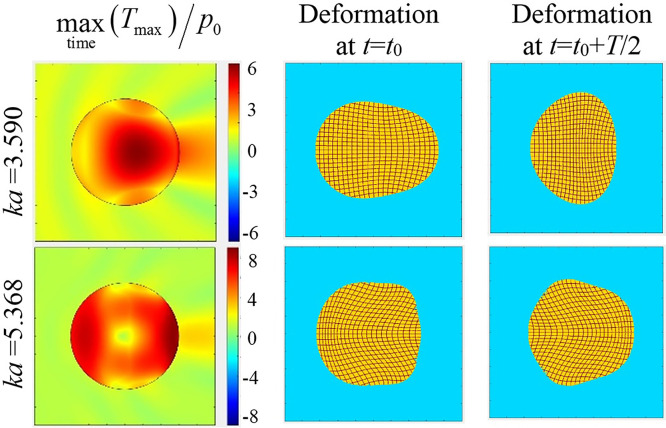
FIG. 2.
(Color online) The distribution of the maximum-in-time of the maximum principal stress for a COM stone (left), as well as the pattern of the stone deformation in the process of its oscillations (center and right) at the 1st and 2nd lowest resonance frequencies, and . Here, is a moment in time and is the wave period.

