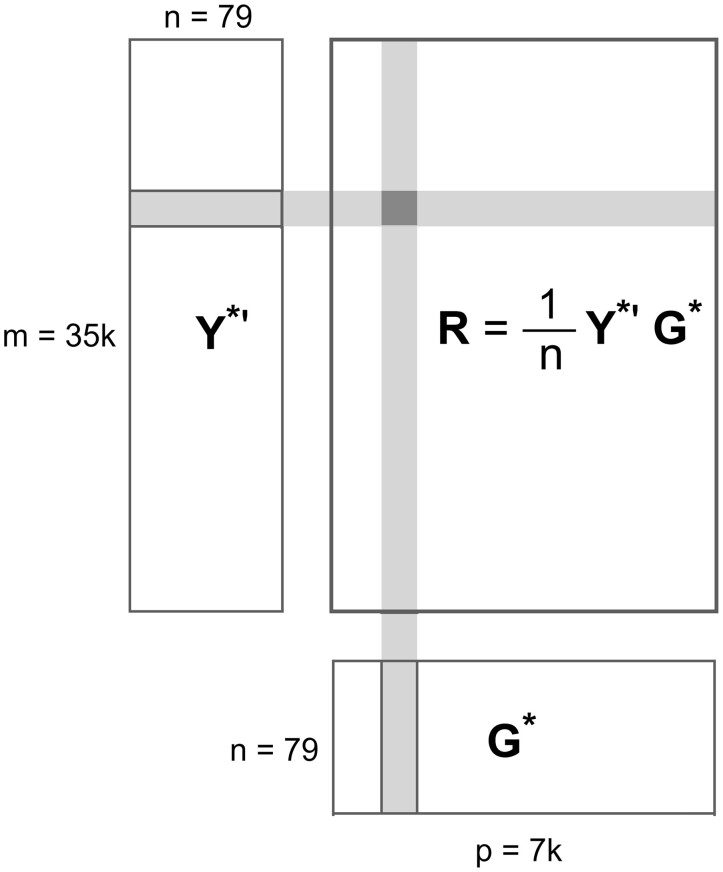
Figure 1.
Schematic of data and correlation calculation: is a standardized expression phenotype matrix, is a standardized genotype matrix, and R is a correlation matrix. An entry in R (shaded dark gray) is obtained by summing the product of the entries of the corresponding row of and the corresponding column of (both shaded light gray). The matrix of LOD scores is an element-wise function of the correlation matrix.

