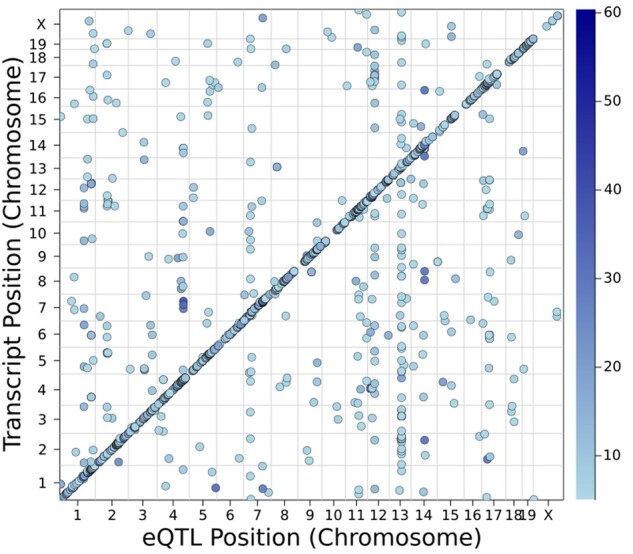
Figure 2.

Distribution of eQTL across genome in the BXD spleen dataset. On the vertical axis, we plot the physcal location of the cognate gene for a transcript; transcripts without a good match to a known gene are not shown. On the horizontal axis, we plot the location of the marker with the highest LOD score for each transcript provided it exceeded 5.
