
Figure 7.
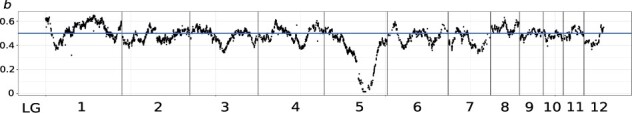
Estimated frequency of two sex-diplotype combinations among homozygous F2 individuals, b. See text for the definition of b. The global minimum on LG5 indicates the sex-determining region. The blue line represents the null hypothesis of b = 0.5.