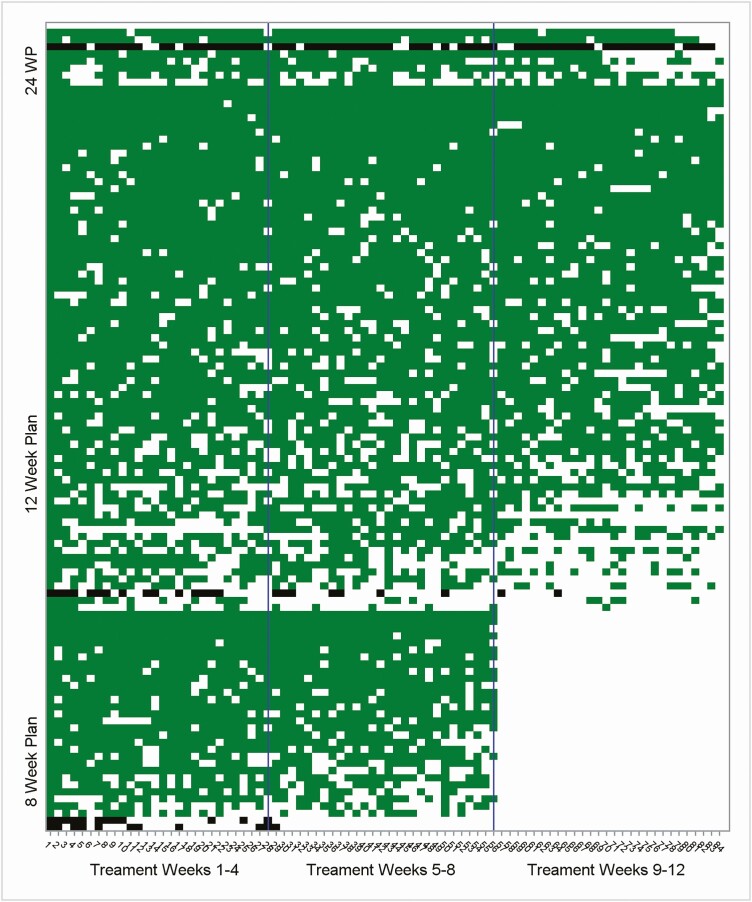
Figure 1.
Daily time frame adherence heat map across all 113 participants treated with combination direct-acting antivirals. The y-axis represents each participant. The order of the participants was sorted by planned weeks (24, 12, and 8) in a descending manner. Within each planned week, the participants axis is further sorted by total doses, again in a descending manner. The x-axis represents the treatment days, and the reference lines on the x-axis divide weeks 1–4, 5–8, and 9–12. The green areas represent days with adherent doses among participants with successful sustained viral response (SVR), whereas the black areas represent days with adherent doses among participants with failed SVR. The white areas represent days with missed doses or the nonapplicable doses for the 9–12 treatment weeks of the 8 planned weeks.

