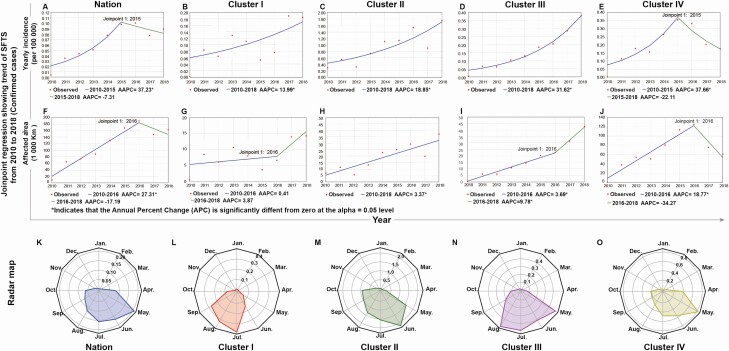
Figure 2.
Temporal trend and seasonality of SFTS epidemics in China from 2010 to 2018. Blue solid lines indicate the trends in the annual incidence of confirmed cases and in total areas of affected townships for the nation (A and F) and the 4 geographic clusters (B‒E and G‒J) fitted by joinpoint regression. Lines change color from blue to green if a joinpoint is identified. AAPCs were estimated based on the slopes of the lines. Red dots indicate observed incidence. Panels K‒O indicate seasonal pattern of confirmed SFTS patients in the nation and clusters I‒IV, respectively. Seasonality is presented as a radar diagram. Circumference is divided into 12 months in a clockwise direction, and the radius represents average monthly incidences over 2010‒2018. Abbreviations: AAPC, average annual percentage changes; SFTS, severe fever with thrombocytopenia syndrome.

