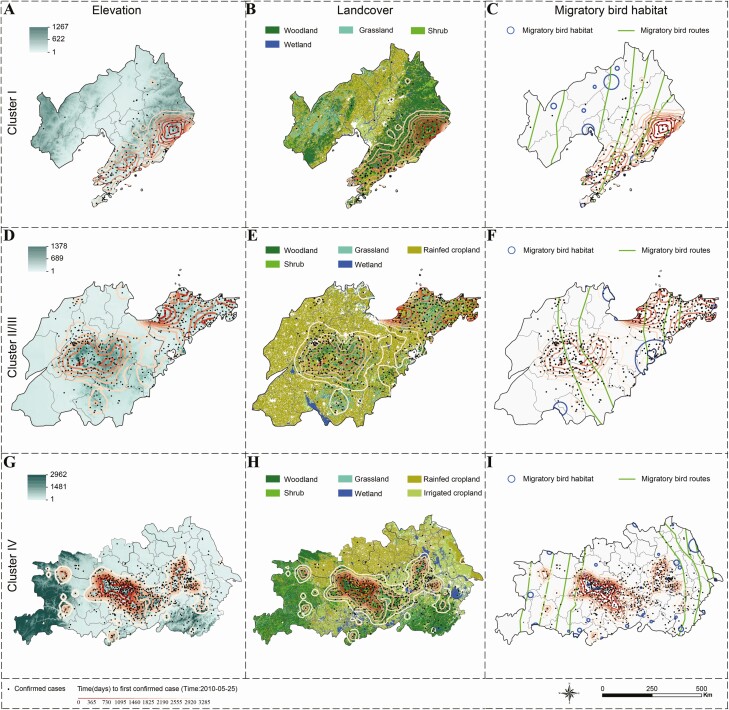
Figure 3.
Association between spatial diffusion and influential factors identified by the Cox proportional hazards model by geographic cluster. Spatial diffusion is represented by the trend surface contour plots with darker color indicating earlier importation time of the first case in the township. Columns correspond to the influential factors: elevation (A, D, G), land cover (B, E, H), and distance to the nearest migratory bird habitat (C, F, I); rows are arranged according to geographic clusters: cluster I (A‒C), clusters II and III (D‒F), and cluster IV (G‒I).

