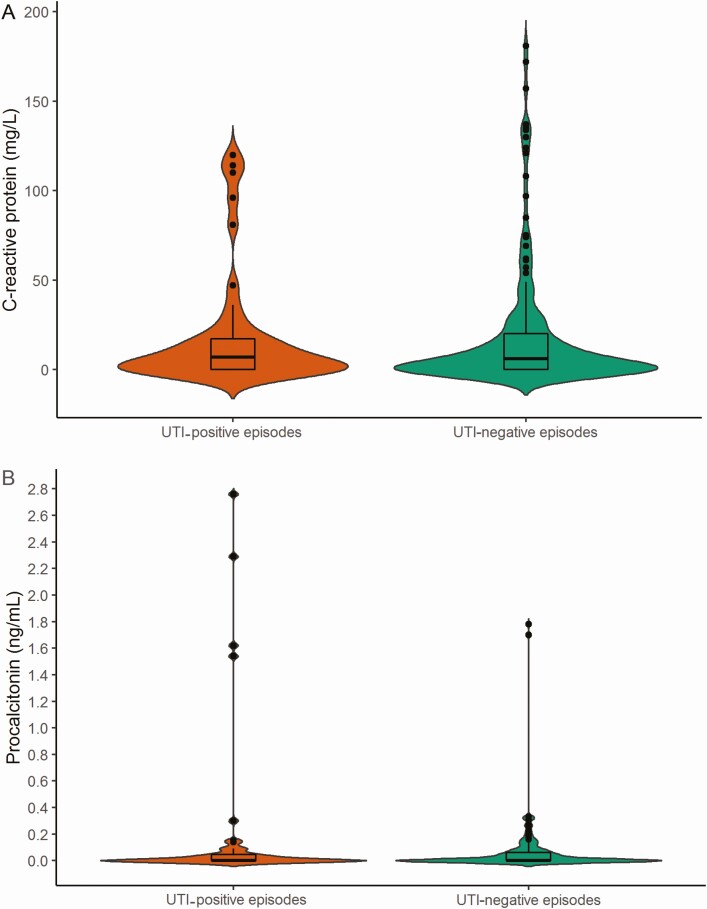
Figure 3.
Distribution of (A) C-reactive protein and (B) procalcitonin concentrations in UTI episodes fulfilling or not fulfilling the stringent “true” UTI definition. Violin plots with a box plot overlay showing (A) the distribution of C-reactive protein in UTI-positive (orange; n = 44) and in UTI-negative episodes (green; n = 181) and (B) the distribution of procalcitonin in UTI-positive (orange; n = 46) and in UTI-negative episodes (green; n = 169). The widths of the orange and green areas show the proportion of cases along the concentration of C-reactive protein or procalcitonin. The box plots show the medians, interquartile ranges, and outliers. There was 1 observation left out: procalcitonin 35 ng/mL, UTI negative. UTI-negative episodes were defined as episodes that did not fulfill the stringent “true” UTI definition; UTI-positive episodes were defined as episodes that did fulfill the stringent “true” UTI definition. Abbreviation: UTI, urinary tract infection.

