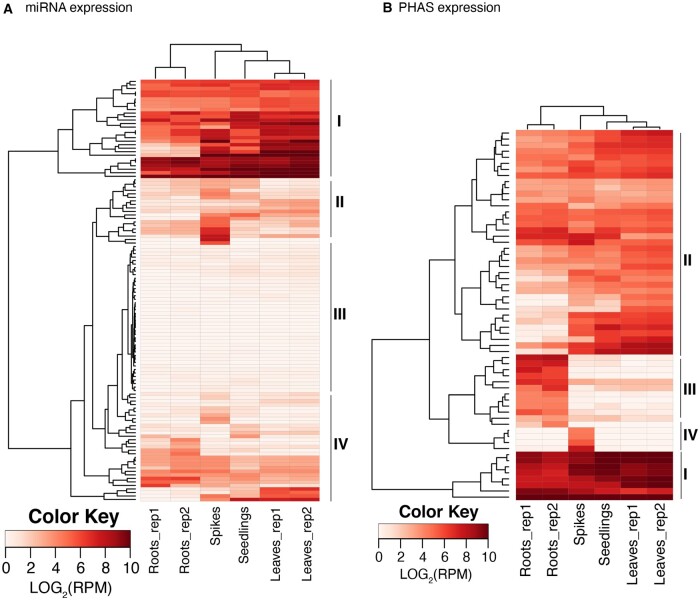
Figure 5.
miRNA and phasiRNA expression. Heatmaps of miRNA (A) and phasiRNA (B) expression in different Ae. tauschii tissues. The rows represent mature miRNAs and PHAS loci, respectively, and the columns represent samples from mature leaves (2 replicates), roots (2 replicates), seedlings, and spikes. The miRNAs and PHAS loci were grouped into four different clades (I–IV) based on the expression level.

