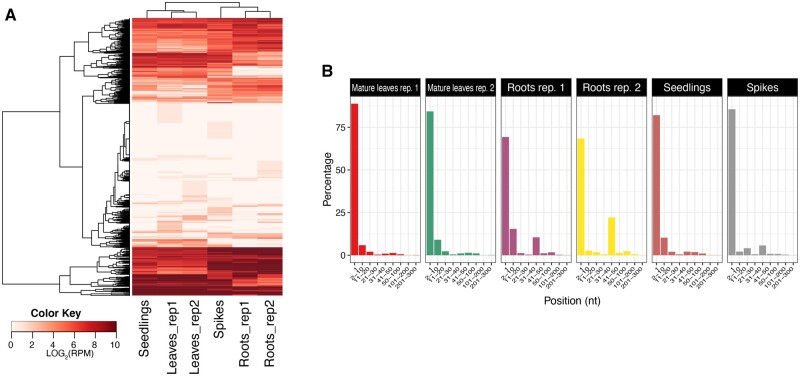
Figure 7.
Characterization of tRNA-derived fragments. (A) Heatmap of tRNA-derived fragments in Ae. tauschii tissues. The rows of the heat map represent tRNA genes and the columns represent samples. (B) Origins of the tRNA-derived fragments in the six Ae. tauschii samples. The tRFs are classified depending on their original position within the tRNA molecule. The x-axis represents the positions within each tRNA (divided into nine different bins) and the y-axis represents the abundance (in %).

