
Figure 6.
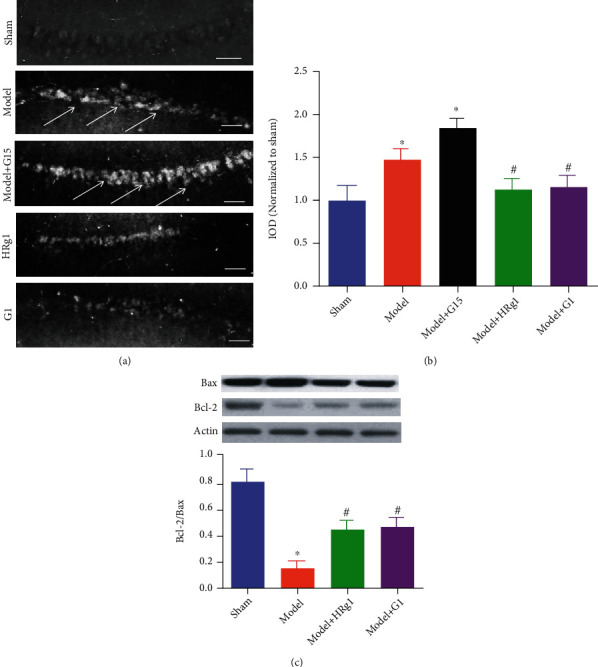
Ginsenoside Rg1 inhibited hippocampal neuronal apoptosis induced by BCAS modeling. (a) TUNEL staining; arrows indicate the apoptotic cells; scale bar: 50 μm. (b) Apoptotic cell count; (c) Bcl-2/Bax expression level and representative bands of Bcl-2 and Bax. ∗P < 0.05, vs. the sham group, #P < 0.05, vs. the model group (N = 5 in each group).