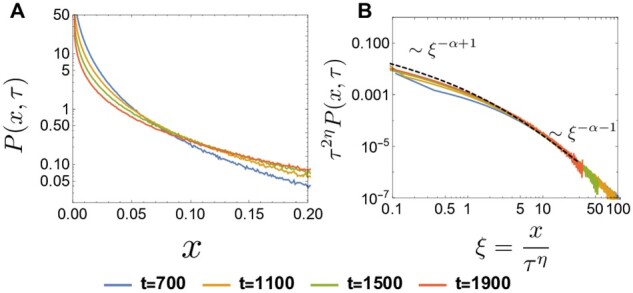
Figure 11.

(A) Log plot of at generations computed from the discrete-time model. and . (B) Log–log plot of versus , where , at (solid curves). The dashed curve represents the analytic result of (see Appendix F). The curves at the different time points collapse into , supporting the scaling ansatz in Equation 37.
