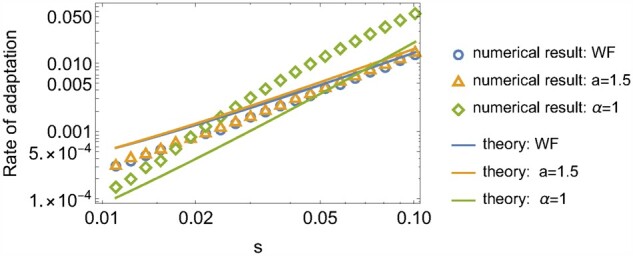
Figure H1.

The open markers show the numerical results of R as a function of s, while the curves show the theoretical predictions, based on the heuristic argument. The m rate of beneficial mutations is . The population size is for α = 1, for , and for the Wright–Fisher model.
