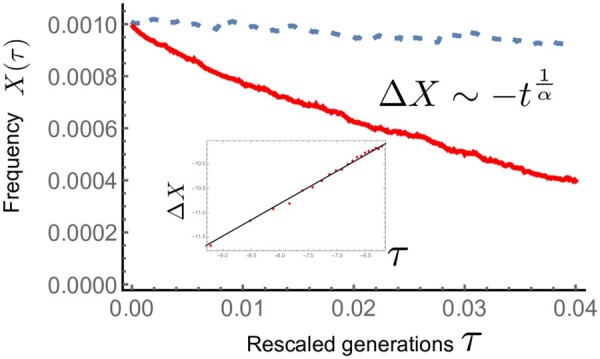
Figure 2.

Trajectories of the median (red thick line) and the mean (blue dashed) of allele frequency when and . Inset: The trajectory (red points) of is shown in log–log plot. The median agrees well with the expectation from the scaling argument (black solid line).
