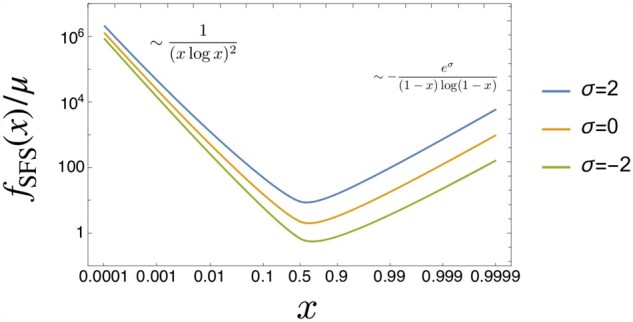
Figure A1.

The SFS when α = 1 for the selective advantage . is obtained by numerically evaluating the exact expression of t(x) in the first line of Equation A.5. As , f(x) becomes independent of σ. Near x = 1, while the magnitude of f(x) depends on σ, the scaling behavior (slope in the log–log plot) does not. See Equation A.14.
