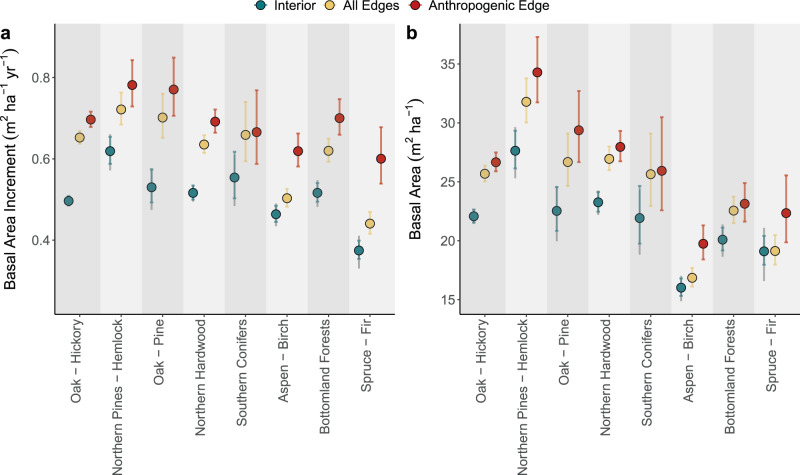
Fig. 1. Forest edges have elevated growth and basal area.
BAI (a) and BA (b) show the average marginal effects of edge-class and forest-type from GLM outputs. Results are presented in Interior, All edges, and Anthropogenic edge groups and ordered by forest type abundance (Supplementary Fig. 5). Interior and All Edge groups have n = 6607 independent subplots, anthropogenic edges have n = 4327 independent subplots. Data are presented as the mean marginal effects with inner error bars showing 95% confidence intervals on the marginal effects; outer error bars on interior group are for comparison with anthropogenic edges.

