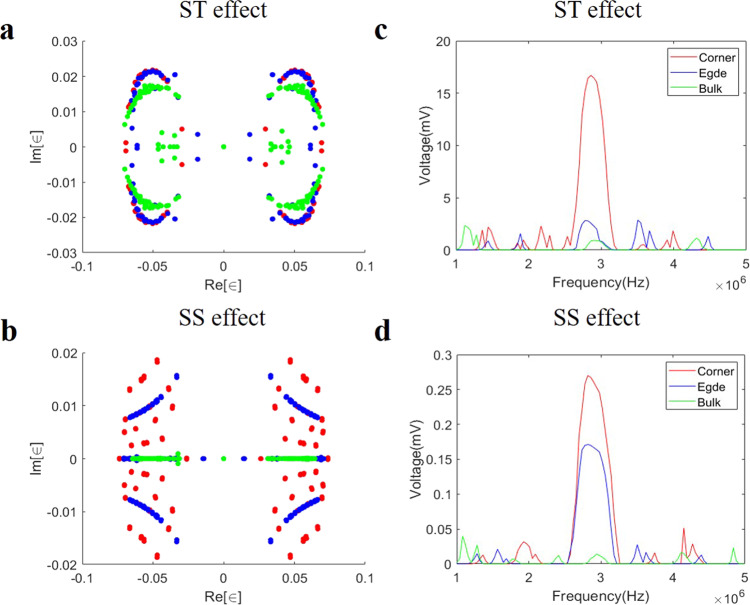
Fig. 4. The experimentally measured spectra and the voltage (corner, edge, and bulk) dependence on AC driving frequency for the hybrid second-order skin-topological (ST) and skin-skin (SS) effects.
a, b The spectra of the fabricated electric circuit for the hybrid second-order ST effect (a) and SS effect (b). ∈ is eigenvalue. Red, blue and green dots represent the spectra subject to double periodic boundary conditions, x-periodic, y-open boundary conditions, and double open boundary conditions respectively. Comparison with Fig. 2 reveals very good agreement with theory. c, d The voltages (corner, edge, and bulk) with the frequency for the hybrid second-order ST and SS effects. Red, blue and green lines represent the voltages of sites at the corner, edge, and bulk, respectively, with the corner voltage peaking at the resonant frequency as expected from theory (Eq. 2).

