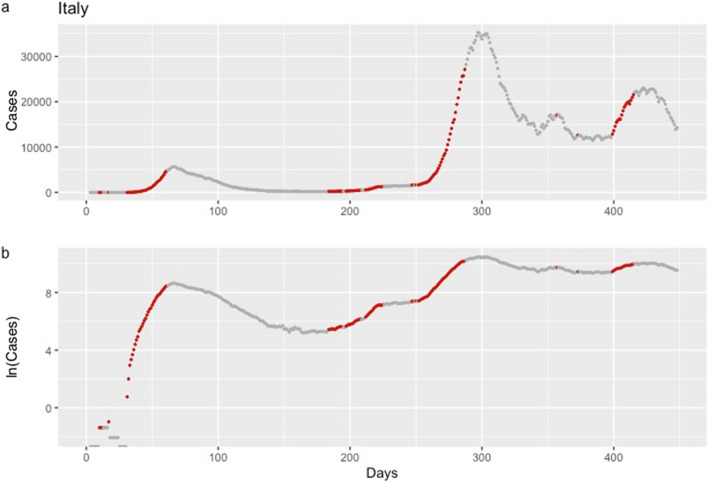
Figure 3.
Daily confirmed cases of COVID-19 in Italy, from January 22, 2020, until April 13, 2021. Analysis is based on the criterion aiming to detect an increase in the mean of expected cases equal or higher than 20%. Red dots correspond to dates that, according to the Epidemic Volatility Index (EVI), an early warning was issued indicating that a rise in the COVID-19 cases is expected. Data are presented on the original scale (1a) and the logarithmic scale (1b), which facilitates the comparison of the steepness of the epidemic curve between the different waves.

