
Fig. 2. Ancestral relationships and trait convergence across root-colonizing fungal endophytes.
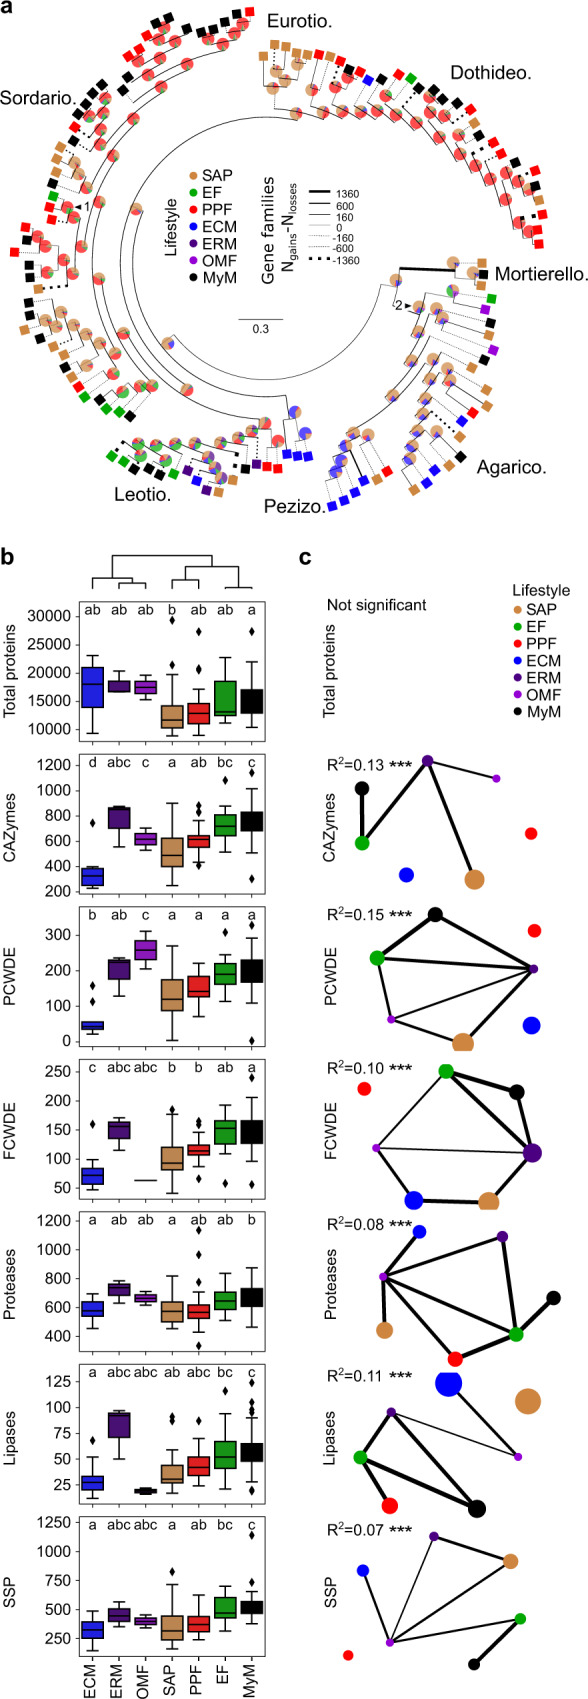
a Lifestyle-annotated whole-genome phylogeny of the 41 selected mycobiota members (MyM, black) and 79 published fungal genomes (SAP saprotrophs, EF endophytic fungi, PPF plant pathogenic fungi, ECM ectomycorrhiza, ERM ericoid mycorrhiza, OMF orchid mycorrhizal fungi). Pie charts on ancestor nodes show lifestyle probabilities of each ancestor, as identified by a Random Forest model trained on 79 non-mycobiota genome compositions in gene families (R2 = 0.70). Two arrows highlight ancestral lifestyle predictions which corroborate previous reports: (1) the pathogenic ancestor of the endophyte Colletotrichum tofieldiae (2) the saprotrophic ancestor of ectomycorrhizal fungi and Sebacinales. Branch width is proportional to the gene family gains-losses difference (Ngains − Nlosses). Line is dotted when this difference is negative. b Genomic counts (n = 120) of genes involved in fungal-host/environment associations (CAZymes carbohydrate-active enzymes, PCWDEs plant cell-wall degrading enzyme, FCWDEs fungal cell-wall degrading enzyme, SSPs small secreted proteins; PCWDEs and FCWDEs are CAZyme subsets). Boxes are grouped according to UPGMA hierarchical clustering on mean counts over the different categories. They are delimited by first and third quartiles, central bars show median values, whiskers extend to show the rest of the distribution, but without covering outlier data points (further than 1.5 interquartile range from the quartiles, and marked by lozenges). ANOVA-statistical testing (Counts~PhylogenyPCs+Lifestyle, Methods) identified both phylogeny and lifestyles as having an effect on genomic contents. The letters highlight the result of a two-sided post hoc TukeyHSD test that compares count differences exclusively due to the lifestyle. c Networks showing the results of a PERMANOVA-based comparison of gene repertoires (JaccardDistances~Phylogeny+Lifestyle, see Supplementary Data 3 for detailed R2 and P-values). Networks for each category are labeled with Lifestyle R2 values. ***P < 0.001 (Supplementary Fig. 6). Lifestyles are connected if their gene compositions are not significantly different. Node size is proportional to the area of one lifestyle’s ordination ellipse on a Jaccard-derived dbRDA plot constrained by lifestyles, and reflects the intra-lifestyle variability. Edge weights and widths are inversely proportional to the distance between ordination ellipse centroids.