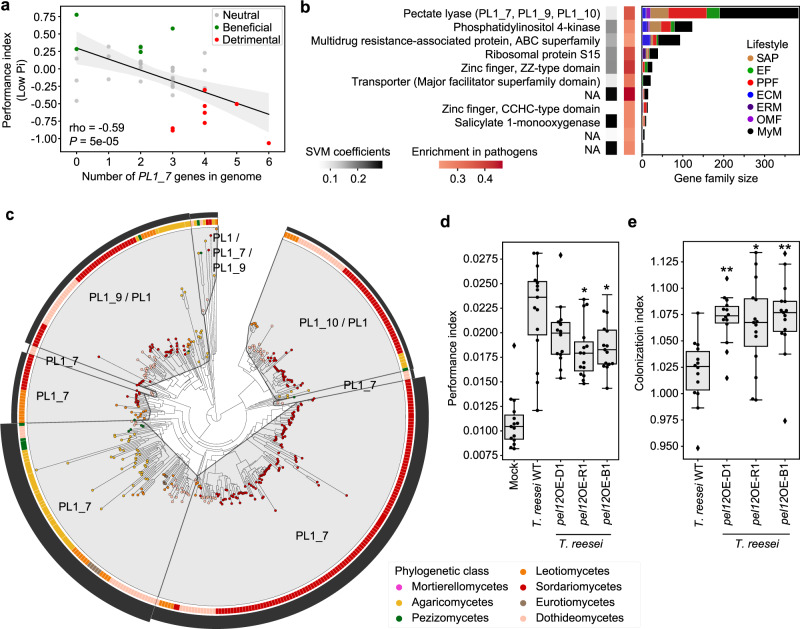
Fig. 6. Genomic content in polysaccharide lyase PL1_7 links colonization aggressiveness to plant health.
a Spearman’s rank correlation between the number of genes encoding secreted PL1_7 in fungal genomes and the plant performance index at low Pi in recolonization experiments. b Minimal set of 11 gene families discriminating detrimental from non-detrimental fungi at low Pi (SVM-RFE R2 = 0.88). The first heatmap on the left shows the SVM coefficients, reflecting the contribution of each orthogroup to the separation of the two groups, whereas the heatmap on the right shows the enrichment of these gene families in fungi identified as detrimental in recolonization experiments at low Pi. Gene family sizes and representation in the different lifestyles are shown on the barplots in the context of the whole fungal dataset (n = 120). NA: no functional annotation. c Protein family tree of the polysaccharide lyase orthogroup identified as essential for segregating detrimental from non-detrimental fungi in our SVM-RFE classification model. The tree was reconciled with fungal phylogeny and clustered into minimum instability groups by MIPhy56. Each group is labeled with its CAZyme annotation. The outer circle (black barplot) depicts the relative instabilities of these groups, suggesting two rapidly evolving PL1_7 groups in Sordariomycetes and Agaricomycetes. d Plant performance indices resulting from plant recolonization experiments at low Pi (three independent biological replicates), conducted with Trichoderma reesei QM9414 (WT) and three independent heterologous mutant lines (D1, R1, B1) overexpressing pel12 from Clonostachys rosea (PL1_7 family,57). Asterisks indicate significant difference to T. reesei WT, according to ANOVA (P = 1.45e−12) and a two-sided TukeyHSD test (WT vs. D1: adjusted P = 0.28; WT vs. B1: adjusted P = 3.75e−2; WT vs. R1: adjusted P = 1.19e−2). e Fungal colonization measured by qPCR in colonized roots at low Pi, conducted with T. reesei WT and three pel12 overexpression mutant lines. Asterisks indicate significant difference to T. reesei WT, according to Kruskal–Wallis (P = 6.25e−4) and a two-sided Dunn test (WT vs. D1: adjusted P = 2.4e−3; WT vs. B1: adjusted P = 1.6e−3; WT vs. R1: adjusted P = 1.5e−2). For both d and e, three independent biological replicates were performed resulting in n = 15 data points per condition. Boxes are delimited by first and third quartiles, central bars show median values, whiskers extend to show the rest of the distribution, but without covering outlier data points (further than 1.5 interquartile range from the quartiles, and marked by lozenges). Asterisks highlight the results of post hoc tests: **adjusted P < 0.01, *adjusted P < 0.05.

