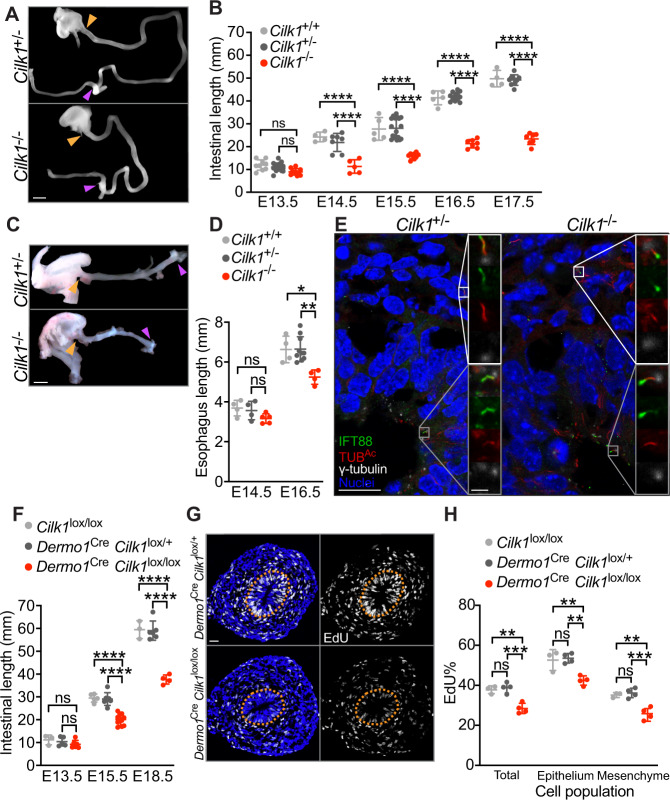
Fig. 1. Mesenchymal cilia are essential for the cell proliferation and elongation of tubular organs.
A E14.5 intestines after separation from the mesentery of Cilk1+/− and Cilk1−/− embryos. The length of the small intestine was measured from the caudal stomach (orange arrowheads) to the rostral cecum (purple arrowheads). Scale bar, 1 mm. B Lengths of the small intestines of Cilk1+/+ (n = 9, 4, 5, 5, 4), Cilk1+/− (n = 18, 7, 18, 12, 9), and Cilk1−/− (n = 10, 5, 9, 7, 7) embryos at E13.5, 14.5, 15.5, 16.5, and 17.5. C E16.5 esophagi of Cilk1+/− and Cilk1−/− embryos. The length of the esophagi was measured from the stomach (orange arrowheads) to the pharynx (purple arrowheads). Scale bar, 1 mm. D Lengths of the esophagi of Cilk1+/+ (n = 4 and 4), Cilk1+/− (n = 4 and 8), and Cilk1−/− (n = 5 and 4) embryos at E14.5 and E16.5 (adjusted P values are 0.0021 for Cilk1+/+ vs Cilk1−/− and 0.0003 for Cilk1+/− vs Cilk1−/−). E Immunofluorescence staining of E13.5 intestinal cross sections from Cilk1+/− and Cilk1−/− embryos for IFT88 (green), ciliary axonemes (TUBAc, red), basal bodies (γ-tubulin, white), and nuclei (Hoechst, blue). Right, higher magnifications of boxed cilia. White boxes highlight mesenchymal cilia and gray boxes highlight epithelial cilia. Scale bar of larger images, 5 μm. Scale bar of enlarged images, 2 μm. F Lengths of E13.5, E15.5, and E18.5 control (Cilk1lox/lox n = 3, 5, 3 and Dermo1Cre Cilk1lox/+ n = 5, 7, 6) and Dermo1Cre Cilk1lox/lox (n = 6, 10, 4) small intestines. G Immunofluorescence staining for EdU (white) and nuclei (Hoechst, blue) in E13.5 Dermo1Cre Cilk1lox/+ and Dermo1Cre Cilk1lox/lox intestines. Scale bar, 25 μm. Orange dotted lines outline the epithelium. H The percentage of EdU-positive cells in the whole intestine, the epithelial cells and the mesenchymal cells in Cilk1lox/lox (n = 3), Dermo1Cre Cilk1lox/+ (n = 4) and Dermo1Cre Cilk1lox/lox (n = 4) embryos at E13.5. For each intestine, we averaged the percentages from three sections. B, D, F, and H Each point in the scatter plots represents the value from an individual embryonic intestine or esophagus. Horizontal bars indicate means ± SD. ns, p > 0.05; *p < 0.05; **p < 0.01; ***p < 0.001 and ****p < 0.0001 indicate adjusted P values between indicated samples by two-way ANOVA Tukey’s multiple comparisons test. Source data are provided in the Source Data file.

