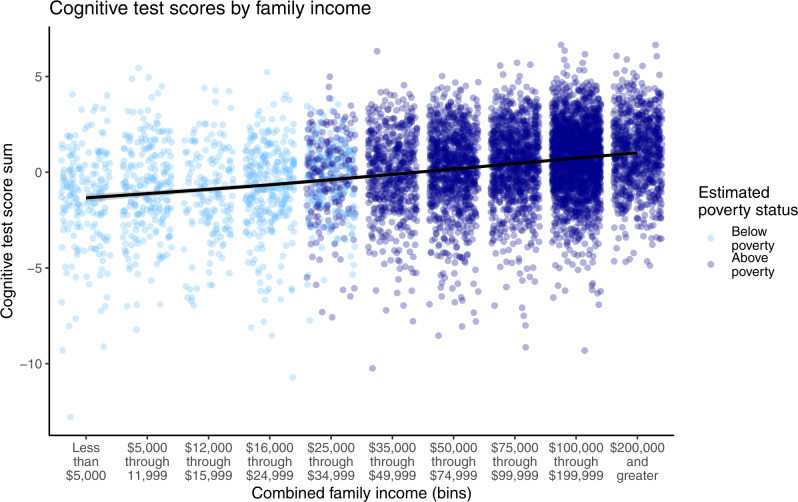
Fig. 1. Illustration of the variability of cognitive test performance within every level of family income in the sample (N = 6839).
Colors indicate whether children’s households were classified as in poverty, based on a combination of their family income and the number of people in the home. Replicating prior studies, higher income is associated with higher cognitive test performance (R = 0.24); however, it is important to acknowledge this substantial variability within and overlap between children at each level of family income.

