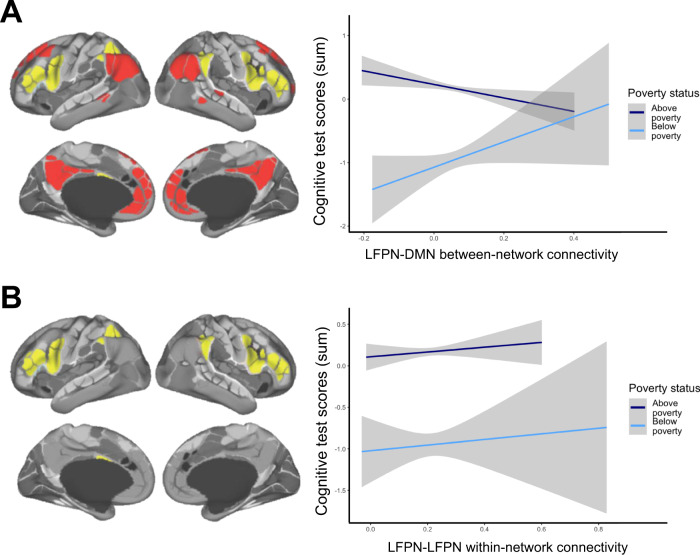
Fig. 2. Relations between resting state network metrics and cognitive test score residuals, for children living above poverty (dark blue) and below poverty (light blue).
Mixed models include fixed effects for age and motion and a random effect for study site. Data are presented as mean values + /−95% confidence intervals for a linear model, calculated and displayed using the geom_smooth function in ggplot. A Children in households above poverty show an expected, negative, relation between LFPN-DMN connectivity and test performance, B = −1.41, SE = 0.45; p = 0.002, while children in households below poverty show the opposite pattern, B = 2.11, SE = 1.12; p = 0.060, interaction: X2(1) = 8.99, p = 0.003. B Children across the sample show a non-significant positive relation between LFPN-LFPN within-network connectivity and test performance, above poverty: B = 0.34, SE = 0.36; p = 0.346; below poverty: B = 0.24, SE = 0.87; p = 0.783; interaction: X2(1) = 0.0005, p = 0.982. Networks functionally defined using the Gordon parcellation scheme; on left, lateral frontoparietal network (LFPN) is shown in yellow and default mode network (DMN) shown in red, figures adapted from110 and reprinted by permission from Oxford University Press and the authors.

