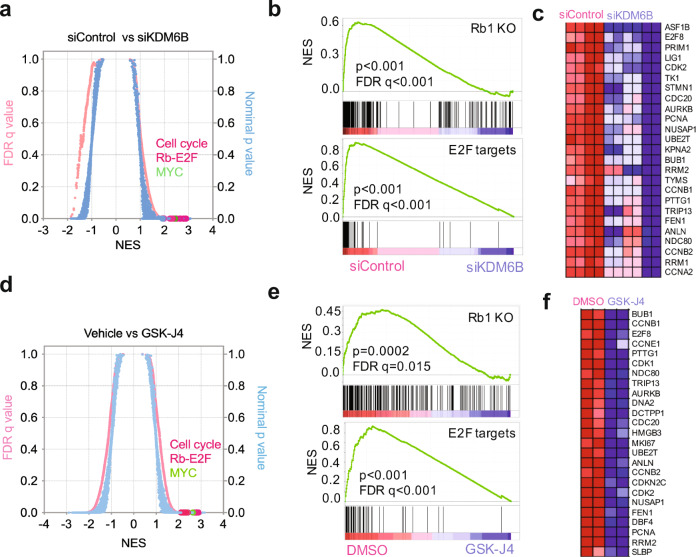
Fig. 2. KDM6B predominantly regulates the pRB-E2F pathway.
a Quantitative comparison of all chemical and genetic perturbation gene sets (n = 3403) from the MSigDB by gene set enrichment analysis (GSEA)92 for increased (left) and reduced (right) expression of global genes caused by KDM6B knockdown. Data are presented as a scatterplot of normalized p value (right y-axis)/false discovery q value (left y-axis) vs. normalized enrichment score (NES) (x-axis) for each evaluated gene set. The gene sets circled in red color indicate cell cycle, pRB-E2F, and MYC pathway gene sets. p Value calculated by one-sided Fisher’s exact test. The FDR is calculated by comparing the distribution of normalized enrichment scores from many different genesets. b Two examples of GSEA from a show that genes downregulated by depletion of KDM6B are enriched with Rb1 knockout and E2F targets. p Value calculated by one-sided Fisher’s exact test. The FDR is calculated by comparing the distribution of normalized enrichment scores from many different genesets. c Heatmap shows the gene list from the E2F targets (b). d–f Similar analysis for GSK-J4 treatment as shown in (a–c). Source data are provided as a “Source data” file.

