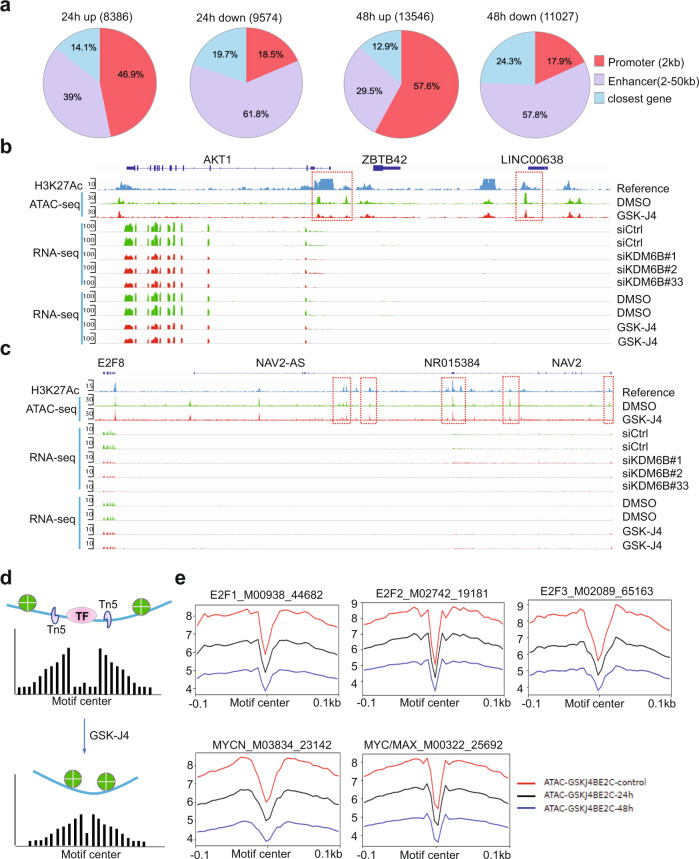
Fig. 4. KDM6B inhibition represses chromatin accessibility of E2F genes.
a ATAC-seq was performed after BE2C cells were treated with 2.5 μM of GSK-J4 for 24 and 48 h. Summary of peak calling number of ATAC-seq (cut-off p < 0.05, log2 fold change ≧ 0.5) including the upregulated and downregulated nucleosome free regions, and the annotated locations of the peaks at defined promoter and enhancer regions. p Value obtained by one-sided Empirical Bayes Statistics test. b Snapshot of AKT1 locus using Integrative Genomic Viewer (IGV) for ATAC-seq, H3K27Ac ChIP-seq, and RNA-seq. The ATAC-seq analysis shows the downregulation of two peaks at the 5′ promoter region of AKT1 and one peak at the non-coding RNA LINC00638. The RNA-seq results showed that the AKT1 transcript was downregulated by 48 h of GSK-J4 treatment and KDM6B knockdown. H3K27Ac in BE2C cells was referenced to GSM2113518109. c Snapshot of E2F8 locus using Integrative Genomic Viewer (IGV) for ATAC-seq, H3K27Ac ChIP-seq, and RNA-seq. The ATAC-seq shows the downregulation of three peaks at the enhancer region of E2F8, next to the NAV2 gene locus. The RNA-seq results showed that E2F8 transcript was downregulated by KDM6B inhibition while the adjacent NAV2 expression is barely detectable. d Cartoon indicates the rationale of footprinting analysis. The DNA motifs bound by transcription factors such as E2F1 protect the cut from transposase Tn5, while the adjacent open chromatin gives rise to a high signal of nucleosome free region after ATAC-seq analysis. After GSK-J4 treatment, the open chromatin was repressed and consequently reducing the reads of free DNA. e Footprinting plot shows the reduction of open chromatin at predicted binding motifs of E2Fs and MYC after BE2C cells were treated with GSK-J4 for 24 and 48 h. Source data are provided as a “Source data” file.

