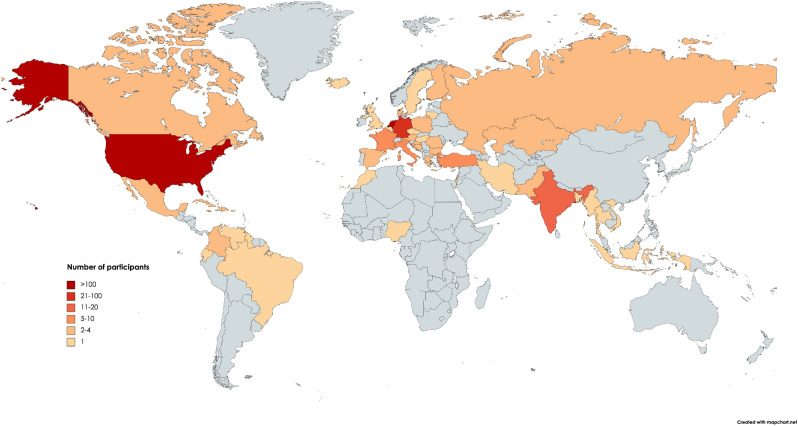
Figure 1.
Topographical distribution of sampled participants. Number of participants are depicted in red-scale using different categories (see legend), with an increasing number of participants per country indicated by an increasingly darker color of red. Note that some participants entered double nationalities and that 58 participants entered either a region (e.g. Asia) or ethnicity rather than nationality. This map was created using Mapchart.net.

