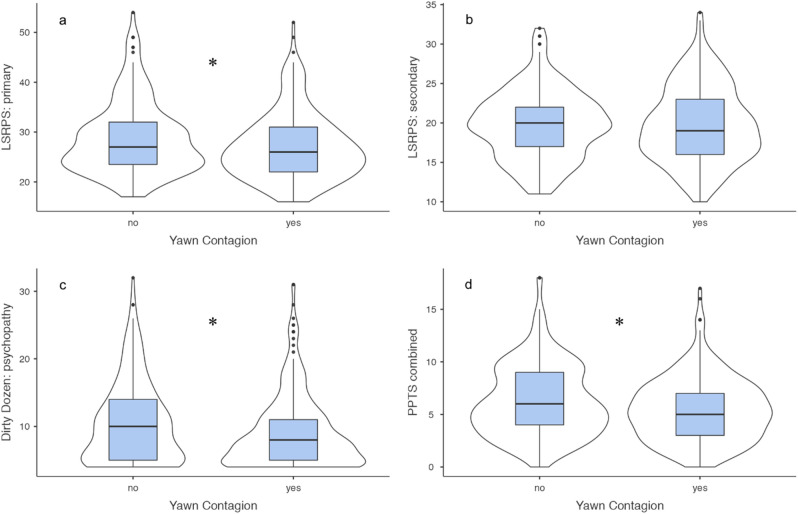
Figure 2.
Box and violin plots depicting the relationship between psychopathic trait scores and contagious yawning. Participants that yawned contagiously scored significantly lower (*p < 0.05) on (a) the primary psychopathy scale of the LSRPS, (c) the psychopathy construct of the Dirty Dozen, and (d) the combined PPTS. There was no difference between yawners and non-yawners on (b) the secondary psychopathy scale of the LSRPS. Box plots represent the median, interquartile ranges, and the whiskers extend 1.5 times the interquartile range for the upper and lower boundary, while the violin plots illustrate the distribution of the psychopathy trait scores.

