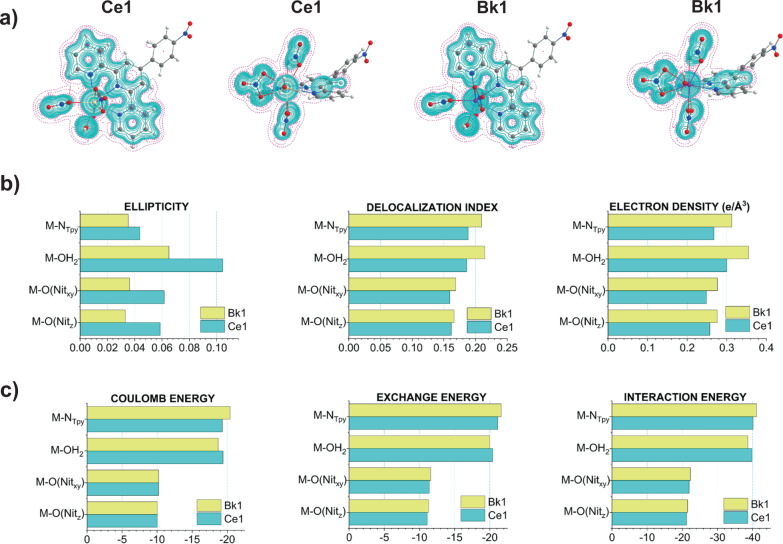
Fig. 5. Bonding features of the plane of covalency based on the CASSCF electron densities.
a Plots of the total energy density, H(r), in the preferential plane of interaction for Ce1 (Ce = yellow sphere) and Bk1 (Bk = purple sphere) and perpendicular to this plane. The solid cyan lines denote the regions where H(r) is negative (covalent character), while pink dashed lines represent areas where H(r) is positive (purely ionic). The water molecule as well as the terpy* N atoms display covalent interactions with the metal centers in both Ce1 (cyan bars) and Bk1 (yellow bars) compared to the nitrate ligands. b QTAIM metrics for Ce1 and Bk1; the ellipticity describes the deviations from a cylindrical single bond as values differ from zero, while delocalization indices and electron densities describe the shared pairs of electrons and accumulation of electrons in the bond critical points, respectively. c Interacting quantum atom (IQA) energy decomposition analysis in kJ mol−1. The total energy of interaction is decomposed into Coulomb or electrostatic and exchange or covalent energy components. M–Nterpy correspond to average metrics of the three metal–terpy* bonds; M–O(Nitxy) and M–O(Nitz) refer to metal–nitrate bonds in the plane (equatorial) and out of the plane (axial), respectively. Tables with detailed information of QTAIM and IQA can be found in the Supplementary Information.

