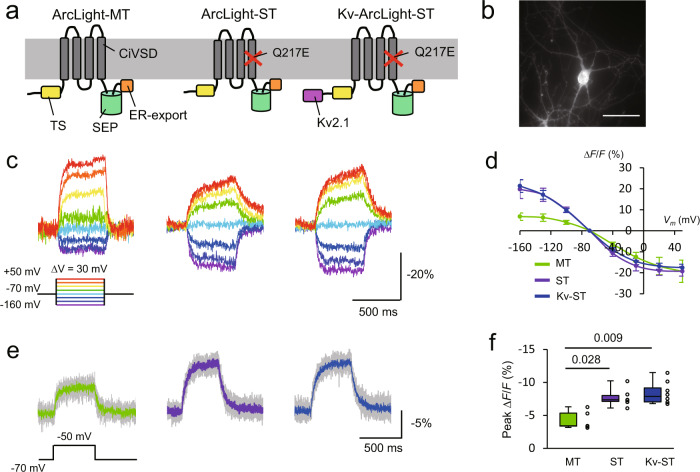
Fig. 1. Design and characterization of ArcLight variants with one-photon imaging in vitro.
a Schematic drawing of ArcLight variants. TS, the export signal from the Golgi apparatus. SEP super ecliptic pHluorin. b A one-photon image of a cultured hippocampal neuron expressing Kv-ArcLight-ST. Scale bar, 50 μm. ArcLight variants were expressed under CMV promoter using calcium phosphate. c Optical signals during depolarizing and hyperpolarizing voltage steps in voltage-clamp mode. d Relationship between membrane potential and normalized fluorescence (mean ± SEM). n = 5 cells for each ArcLight variant. e Optical responses to small depolarizing voltage steps of 20 mV from −70 mV. Gray traces are individual trials, and colored traces are an average of five trials. f Peak fluorescence change in response to depolarizing voltage steps of 20 mV. n = 5 cells (ArcLight-MT), 6 (ArcLight-ST), 8 (Kv-ArcLight-ST). The Steel-Dwass test was used for statistical analysis. Excitation: 460–500 nm, ~5.5 mW (~ 36 mW/mm2) at the stage. Imaging was performed at 1 kHz. On each box, the central line represents the median, and the bottom and the top edges of the box represent the 25th and 75th percentile, respectively. The lower and the upper whiskers extend to the minimum and the maximum data points, respectively. Numbers on the graphs represent P values.

