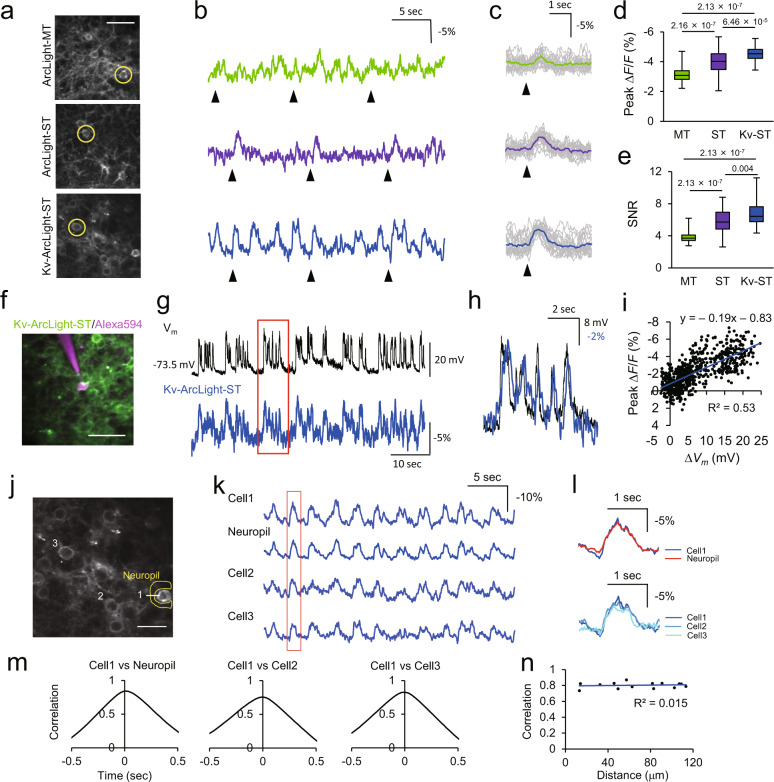
Fig. 3. Performance of ArcLight variants with two-photon imaging in vivo.
a Two-photon images of cells expressing ArcLight variants in V1. Scale bar, 40 μm. b Representative traces of ArcLight variants in the cells indicated with circles in (a) in vivo. Arrowheads indicate timing of visual stimulation with flash light of 10 ms. c Stimulus-triggered average. Gray traces are individual trials, and colored traces are average of 20 trials. Arrowheads indicate timing of visual stimulation. d, e Peak ΔF/F (d) and SNR (e) for visually evoked optical signals. n = 56 cells from 2 mice (ArcLight-MT), 77 cells from 5 mice (ArcLight-ST) and 62 cells from five mice (Kv-ArcLight-ST). Steel-Dwass test was used for statistical analysis. f A two-photon image of a Kv-ArcLight-ST-expressing neuron recorded with whole-cell patch-clamp in vivo. Alexa594 was filled through a patch pipette. Scale bar, 50 μm. g Simultaneous current-clamp recording and two-photon voltage imaging in vivo. h Magnified optical trace overlaid with electrical trace in the area shown with a red rectangle in (g). i Correlation between electrical and optical signals (2 cells from 2 mice). j–n Spatiotemporal structure of subthreshold events in the local cortical circuits in vivo. j Two-photon image of layer 2/3 neurons expressing Kv-ArcLight-ST. Optical traces of cells and a neuropil indicated with white number and yellow characters are shown in (k). Scale bar, 25 μm. k Fluorescence change of Kv-ArcLight-ST. l Magnified traces in the area shown with a red rectangle in (k). m Cross correlation between cells and neuropil. n Relationship between correlation and distance of neurons. Imaging was performed 150–300 μm below the pial surface (two-photon) in lightly anaesthetized mice (isoflurane, ~1.5% v/v). Excitation: 940 nm, 130–150 mW (0.50–0.61 μW/pixel) at the imaging plane. In each box plots, the central line represents median, and the bottom and the top edges of the box represent 25th and 75th percentile, respectively. The lower and the upper whiskers extend to the minimum and the maximum data points, respectively. Numbers on the graphs represent P values.

