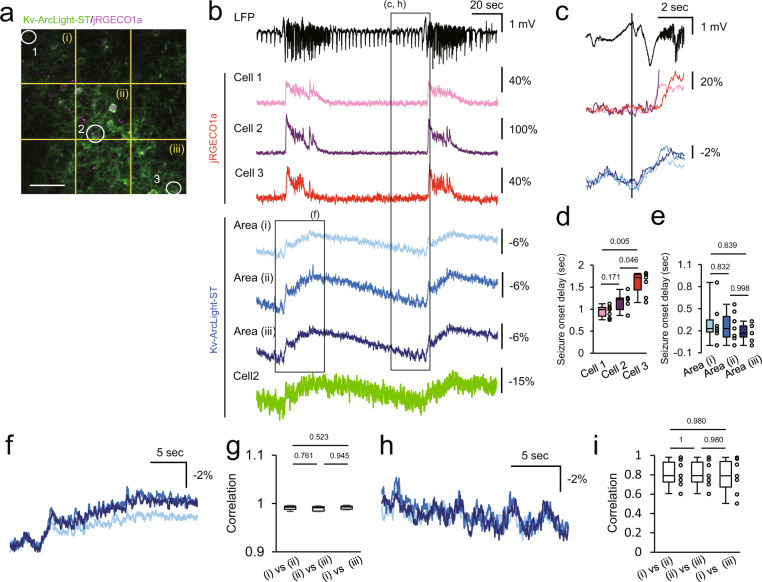
Fig. 8. Spatiotemporal structure of sub- and suprathreshold events in acute focal epileptic seizures in vivo.
a Two-photon image of layer 2/3 neurons expressing Kv-ArcLight-ST and jRGECO1a under CAG promoter in V1. Cells and neuropil indicated with white numbers and yellow characters; their optical traces are shown in (b). Scale bar, 50 μm. b LFP at the 4-AP injection site and fluorescence change of Kv-ArcLight-ST and jRGECO1a about 1–1.5 mm away from the injection site. c Magnified traces from the dotted rectangle in (b). Optical signals of calcium and voltage showed different dynamics at LFP seizure onset. At the imaging site, suprathreshold calcium imaging showed sequential recruitment of neighboring cells, whereas voltage signals were nearly synchronized. d, e Suprathreshold (calcium imaging) (d) and subthreshold (voltage imaging) during LFP seizure onset (e). n = 7 events from 2 mice. Steel-Dwass test was used for statistical analysis. f Optical signals of Kv-ArcLight-ST in 3 areas during seizure. Colors of traces correspond to those in (b). g Correlation of OFP in neighboring areas during electrographic (LFP) seizure. n = 7 events from 2 mice. h Optical signals of Kv-ArcLight-ST in three areas during late interictal period. Individual trace colors correspond to those in (b). i Correlation of OFP in neighboring areas during late interictal period. Optical signals showed similar dynamics in the local cortical circuit in the imaged field of view. n = 7 events from 2 mice. Two-photon imaging was performed in lightly anaesthetized mice with isoflurane (~1.5% v/v). Excitation wavelength was 990 nm, and excitation power was 150–180 mW (0.57–0.69 μW/pixel) at the imaging plane. Steel-Dwass test was used for statistical analysis. In each box plots, the central line represents median, and the bottom and the top edges of the box represent 25th and 75th percentile, respectively. The lower and the upper whiskers extend to the minimum and the maximum data points, respectively. Numbers on the graphs represent P values.

