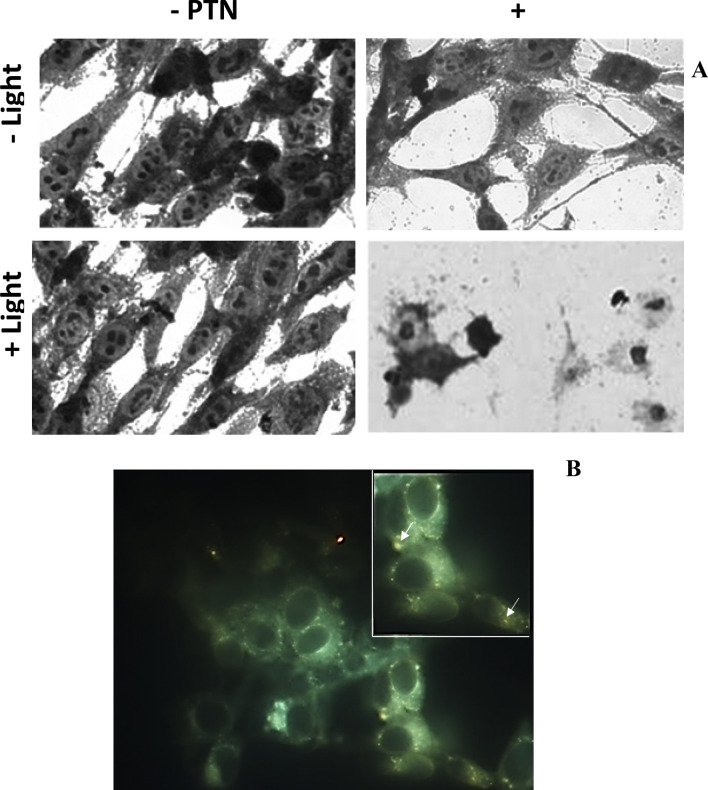
Figure 3.
Morphological changes induced by PTN-PDT in LM2 cells and intracellular PTN localization. (A) LM2 cells were exposed 1 h to 30 µM PTN and immediately illuminated with 1.78 J/cm2. Cells were fixed after overnight incubation and stained by crystal violet for morphology observation. Micrographs were taken employing × 40 magnification. (B) LM2 cells were exposed 1 h to 30 µM PTN and fluorescence was documented at × 20 and × 40 (inset) magnification. Arrows indicate orange granules of PTN. Representative images are shown.

