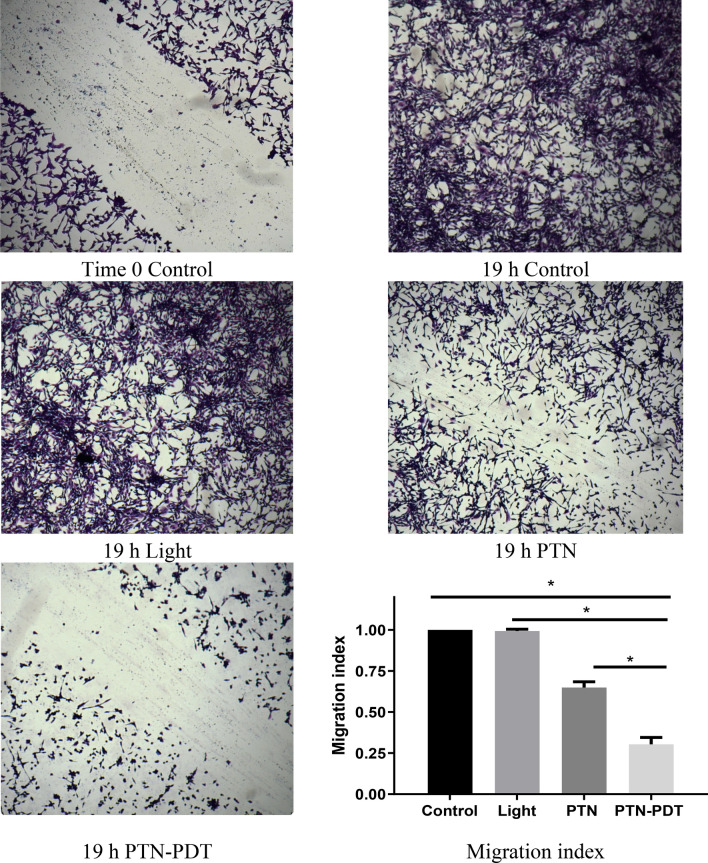
Figure 4.
Impact of PTN-PDT on cell migration. LM2 cells were exposed 1 h to 30 µM PTN and immediately after 1.78 J/cm2 illuminations, they were wounded. Cell migration was documented after overnight incubation (19 h). Representative images processed using image processing software (Fiji ImageJ 2.0.0-rc61/1.51n) are shown: control cells at time 0 before migration (MI = 0), control cells treated with the vehicle at 19 h (MI = 1), illumination and PTN controls at 19 h and PTN-PDT at 19 h. Migration indexes were calculated. *p < 0.0001, ANOVA test followed by Tukey’s multiple comparisons test.

