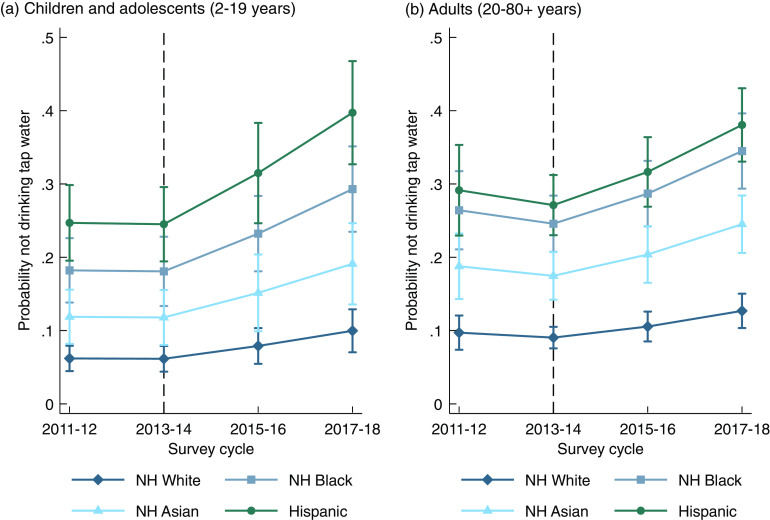
Fig. 2.
Covariate-adjusted predicted probability time trends and 95 % CI of not drinking tap water by race/ethnicity among (a) children and (b) adults, NHANES 2011–2018. Notes: n 9439 children aged 2–19 years; n 17 268 adults; models adjusted for nativity status, sex, age group, income level (federal income to poverty ratio), and educational attainment (of household reference for children, self for adults); dashed line at 2013–2014 indicates beginning of Flint, Michigan Water Crisis. Built from models shown in Supplemental Table 1. NHANES, National Health and Nutrition Examination Survey

