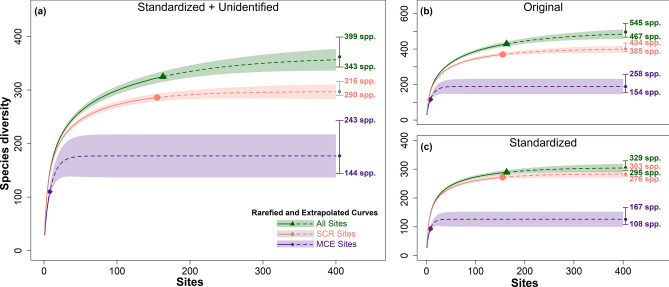
Figure 2.
Species accumulations curves showing MCE, SCR, and all sites under three different methods of reported taxonomic names and species identifications. Solid line indicates the rarefied curve, dashed line indicates the extrapolated curve, symbol indicates the observed species richness, the colored area indicates the 95% confidence interval, and the numbers show the asymptotic diversity estimate. (a) Species identification standardized by consolidating the synonymies and using the unidentified species as reported (standardized + unidentified), (b) original species identification without consolidating synonymies as well as using the unidentified species as reported (original), and (c) species identification standardized by consolidating the synonymies as well as consolidating the unidentified species to a standardized to Genus sp. notation (standardized).

