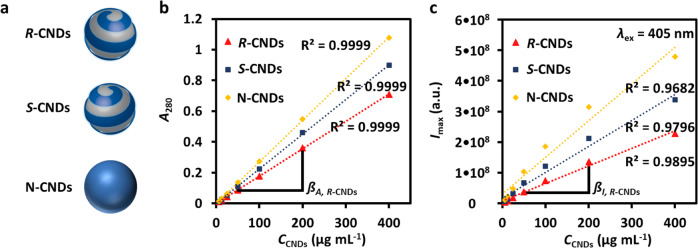
Fig. 1. Carbon nanodots concentration determination through UV-Vis and fluorescence emission spectrophotometry.
a Sketch of the N-, S-, and R-CNDs. b Absorption A280 at 280 nm of CNDs dissolved in water at the mass concentration CCNDs (determined by weighting). The A280(CCNDs) curve was fitted with linear regression to yield the slope ßA,j (mL μg–1) = ΔA280(j) ΔCCNDs–1 (j = R-CND, S-CND, N-CND). R2 indicates the fitting reliability with linear regression (perfect fit: R2 = 1). Data for the absorption at 405 nm (A405) are shown in Supplementary Fig. 6. c Integrated fluorescence emission Imax ranging from 425 to 475 nm (excitation wavelength λex = 405 nm) of CNDs dissolved in water at the mass concentration CCNDs. The Imax(CCNDs) curve was fitted with linear regression to yield the slope ßI,j (mL μg–1) = ΔImax(j) ΔCCNDs–1 (j = R-CND, S-CND, N-CND). From these slopes, first the percentual differences Δßi,j in the slopes between the R-CND and S-CND sample to the N-CND sample were derived for the absorption and intensity measurements as Δßi,j = (ßi,N-CND − ßi,j) ßi,N-CND–1 (i = A, I; j = R-CND, S-CND), and then the deviation Δßj in these differences between the absorption and intensity measurements were obtained as Δßj = |ΔßA,j − ΔßI,j| (j = R-CND, S-CND). The percentual error in concentration determination was defined as the maximum of these values as ΔCCNDs CCNDs–1 = max(ΔßR-CND, ΔßS-CND). The values are enlisted in Table 1. The shown data were obtained with batch #1.

