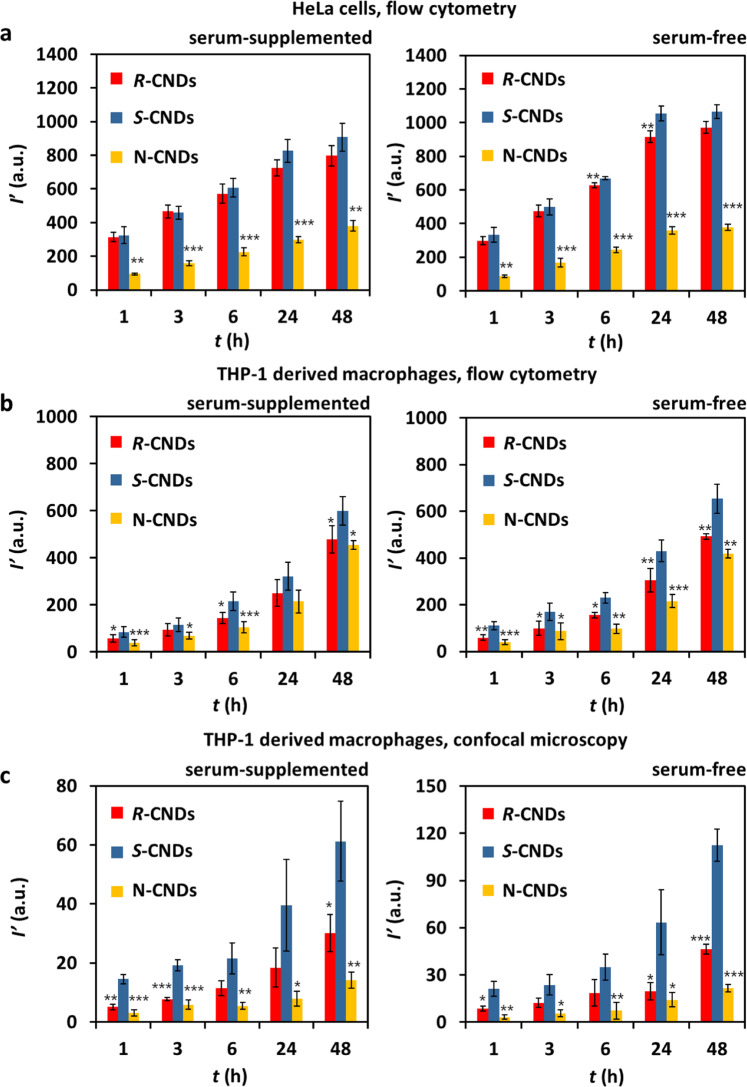
Fig. 3. Uptake of CNDs as quantified by the mean CND fluorescence I′ per cell.
Cells were incubated for different times t at a CND concentration of C′CNDs = 400 μg mL–1 in serum-supplemented (10% FBS) and serum-free medium. a HeLa cells, I′ detected by flow cytometry, see also Supplementary Fig. 22. b THP-1 derived macrophages, I′ detected by flow cytometry, see also Supplementary Fig. 24. c THP-1 derived macrophages, I′ detected by confocal microscopy, see also Supplementary Fig. 12. Results are shown as mean value ± standard deviation (s.d.) from three independent samples (n = 3) over three independent experiments. P values were analyzed by Student’s t test with two-tailed distribution and two-sample equal variance. *P < 0.05, **P < 0.01, ***P < 0.001.

