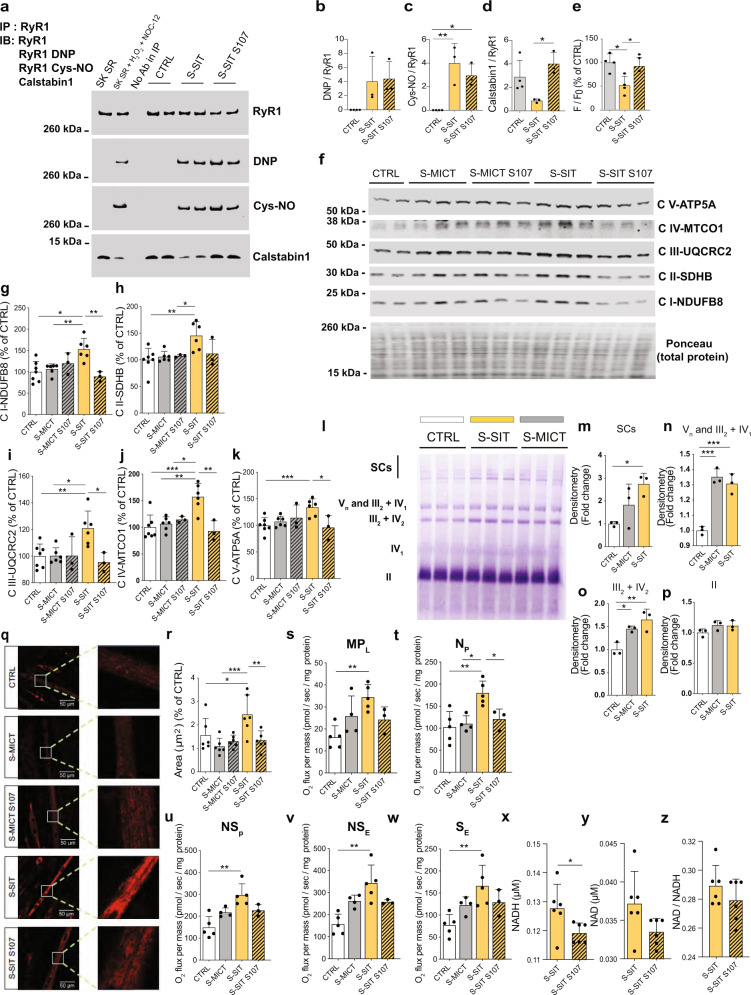
Fig. 3. S-SIT in C2C12 myotubes induces higher mitochondrial protein content, supercomplexes levels and respiratory capacity as compared to MICT, which are blunted by S107-induced RyR1 stabilization.
a–d Representative immunoblots (a) and quantifications (b–d) of immunoprecipitated RyR1 post-translational modifications 3 h post stimulation without or with S107 treatment for 3 h; n = 4 (CTRL) and 3 (S-MICT, S-SIT) independent biological experiments. One-way ANOVA, followed by Tukey’s multiple comparisons test (c, d). e Quantification of Fluo-4/AM fluorescence ratio 3 h post stimulation without or with S107; n = 4 (CTRL, S-SIT) and 3 (S-SIT S107) independent biological experiments. One-way ANOVA followed by Tukey’s multiple comparisons test. f–k Representative immunoblots (f) and quantifications (g–k) of mitochondrial OXPHOS proteins 72 h post stimulation without or with S107 treatment for 72 h. Whole OXPHOS blot shown in Supplementary Fig. 6; n = 7 (CTRL), 6 (S-MICT, S-SIT) and 3 (S-MICT S107, S-SIT S107) independent biological experiments. One-way ANOVA followed by Tukey’s multiple comparisons test. l–p Immunoblots (l) and quantification (m–p) of supercomplexes after stimulations; n = 3 independent biological experiments per group. One-way ANOVA followed by Tukey’s multiple comparisons test (m–o). q–r MitoTracker red fluorescence (q) and quantification of mitochondrial area (r) 72 h post stimulation without or with S107 treatment; n = 6 independent biological experiments per group. One-way ANOVA with Sidak’s multiple comparisons test. s–w O2 flux per mass (pmol/s/mg of protein) 72 h after stimulation and S107 treatment. s MPL: malate pyruvate leak state. t NP: N-linked OXPHOS state with ADP-stimulated. u NSP: N- and S-OXPHOS pathways. v NSE: ET state, noncoupled and w SE, S-pathway; n = 5 (CTRL, S-SIT), 4 (S-MICT) and 3 (S-SIT S107) independent biological experiments. One-way ANOVA with Sidak’s multiple comparisons test. x–z NADH (x), NAD (y) concentration and NADH/NAD ratio (z) in S-SIT myotubes without or with S107 treatment for 72 h; n = 6 independent biological experiments per group. Unpaired t test. For S107 groups, 10 µM of S107 treatment was applied immediately after stimulation for the indicated time. Data are mean ± SD. *p ≤ 0.05, **p ≤ 0.01 and ***p ≤ 0.001. Source data are provided as a Source Data file.

