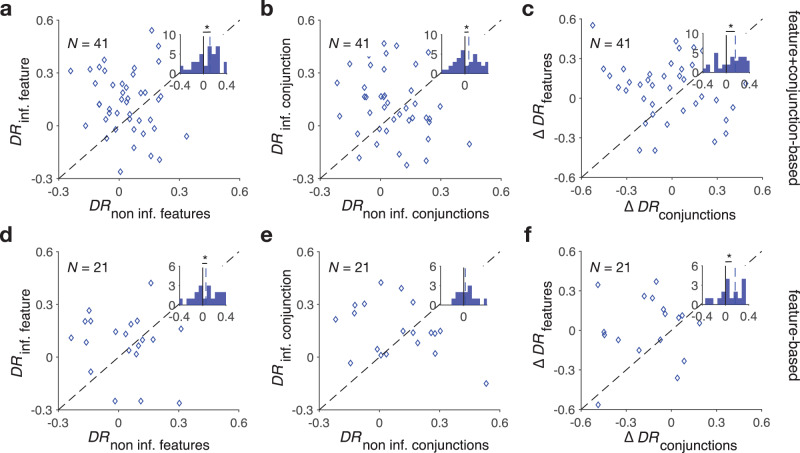
Fig. 3. Direct evidence for adoption of mixed feature- and conjunction-based learning strategy.
a Plot shows differential response for the informative feature vs. differential response for the non-informative features for participants whose choice behavior was best fit by the F+C1 model. The inset shows the histogram of the difference between differential response of the informative and non-informative features. The dashed line shows the median values across participants, and the asterisk indicates the median is significantly different from 0 (two-sided sign-rank test; P = 0.013). b Plot shows differential response for the informative conjunction vs. differential response for the non-informative conjunctions for the same participants. The inset shows the histogram of the difference between differential response of the informative and non-informative conjunctions (two-sided sign-rank test; P = 0.031). c Plot shows the difference between differential response for the informative and non-informative features vs. the difference between differential response for the informative and non-informative conjunctions. The inset shows the histogram of the difference between the aforementioned differences (two-sided sign-rank test; P = 0.025). d–f Similar to a–c but for participants whose choice behavior was best fit by the feature-based model (two-sided sign-rank test; features: P = 0.005, conjunctions: P = 0.15, difference: P = 0.045). Source data are provided as a Source Data file.

