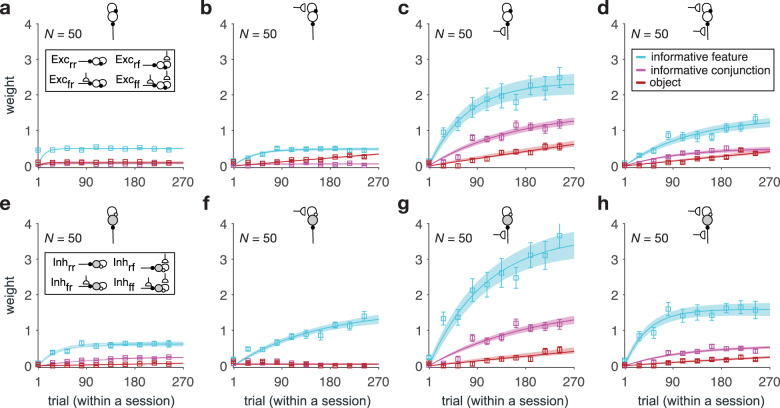
Fig. 6. Response of different types of recurrent populations show differential degrees of similarity to reward probabilities based on different learning strategies.
a–d Plotted are the estimated weights for predicting the response dissimilarity matrix of different types of recurrent populations (indicated by the inset diagrams explained in Fig. 4b) using the dissimilarity of reward probabilities based on the informative feature, informative conjunction, and object (stimulus identity). Error bars represent s.e.m. The solid line is the average of fitted exponential functions to RNNs’ data, and the shaded areas indicate ±s.e.m. of the fit. e–h Same as a–d but for inhibitory recurrent populations. Dissimilarity of reward probabilities of the informative feature can better predict dissimilarity of response in inhibitory populations, whereas dissimilarity of reward probabilities of the objects can better predict dissimilarity of response in excitatory populations. Source data are provided as a Source Data file.

