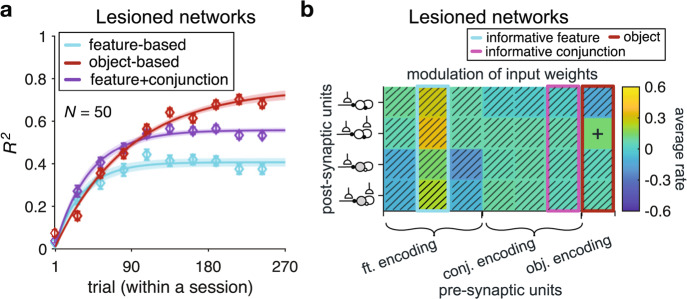
Fig. 8. Lesioning recurrent connections from the inhibitory populations with plastic sensory input (Inhfr and Inhff) to the excitatory populations with plastic sensory input (Excfr and Excff) results in drastic changes in the behavior of the RNNs.
a The plot shows the time course of explained variance (R2) in RNNs’ estimates based on different models. Error bars represent s.e.m. The solid line is the average of exponential fits to RNNs’ data, and the shaded areas indicate ±s.e.m. of the fit. b Plotted is the average rate of value-dependent changes in the connection weights from feature-encoding, conjunction-encoding, and object-identity encoding populations to recurrent populations with plastic sensory input (indicated by the inset diagrams explained in Fig. 4b), during the simulation of our task. The plus sign indicates one-sided significant rate of change (sign-rank test; P < 0.05), whereas hatched squares indicate connections with rates of change that were not significantly different from zero (two-sided sign-rank test; P > 0.05). Highlighted rectangles in cyan, magenta, and red indicate the values for input from sensory units encoding the informative feature, the informative conjunction, and object-identity, respectively. Source data are provided as a Source Data file.

