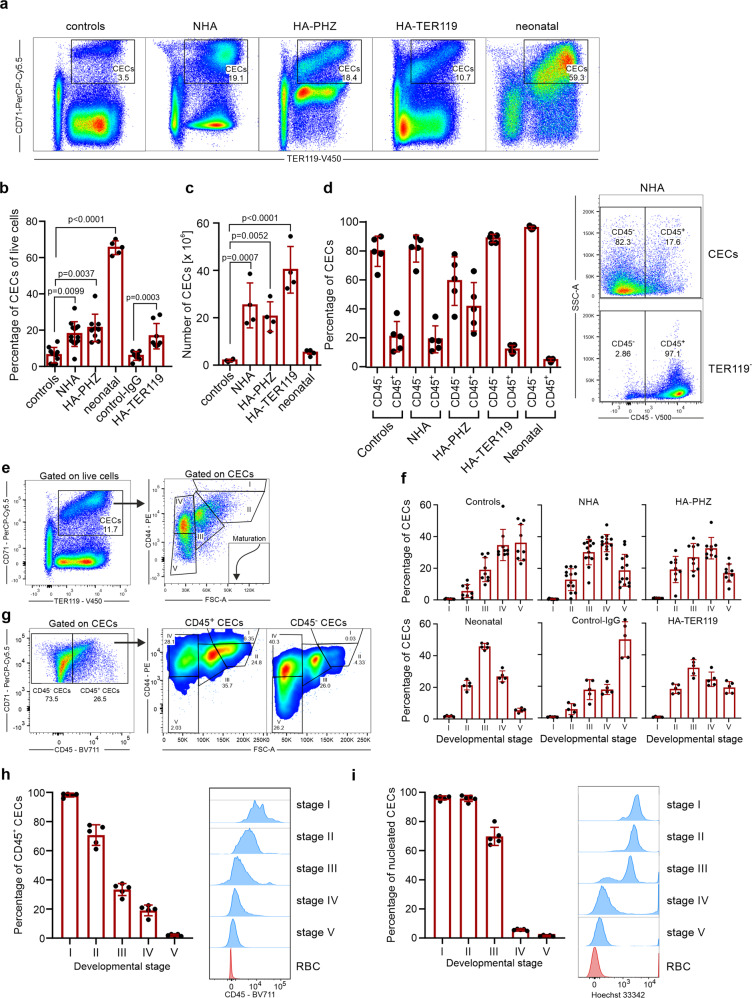
Fig. 1. Anemia induces CECs expansion in the spleen.
a Representative plots of CD71+TER119+ CECs of total live cells in the spleens of control, anemic, and 3-day-old neonatal mice. b The frequency of CD71+TER119+ CECs of total splenocytes in control (n = 10), control-IgG (n = 7), anemic (NHA, n = 13; HA-PHZ, n = 9; HA-TER119, n = 8), and 3-day-old neonatal mice (n = 5). P values were calculated with Kruskal–Wallis test with Dunn’s post hoc test. c Numbers of CD71+TER119+ CECs in the spleens of control (n = 4), anemic (NHA, n = 4; HA-PHZ, n = 4; HA-TER119, n = 4), and neonatal (n = 4) mice. P values were calculated with one-way ANOVA with Dunnet’s post hoc test. d Percentages of CD45.2− and CD45.2+ cells within CECs (CD71+TER119+) population (n = 5). Representative plot of CD45 levels in CECs and TER119− cells in the spleen of NHA mouse. e Gating strategy for CECs developmental stages based on CD44 expression and cells size16. f Developmental stages of CECs in control mice (n = 9), NHA mice (n = 13), HA-PHZ (n = 9), HA-TER119 (n = 5), and neonatal mice (n = 5). g Representative plot of CD71 and CD45 levels in CECs in the spleen of NHA mouse and analysis of developmental stages of CD45+ CECs and CD45− CECs. h Percentages of CD45+ CECs in different developmental stages in the spleens of NHA mice (n = 5). Histograms show the fluorescence of CD45–BV711. Red blood cells (RBCs) are presented as a negative control. i Percentages of nucleated CECs (Hoechst 33342+) in different developmental stages in the spleens of NHA mice (n = 5). Histograms show the fluorescence of Hoechst 33342-INDO-1. Red blood cells (RBCs) are presented as a negative control. Data show means ± SD. Each point in b–d, h, i represent data from individual mice. n values are the numbers of mice used to obtain the data. The source data underlying b–d, f, h, i are provided as a Supplementary Data 2 file.

